Video Marketing
Global Online Entertainment Activities By Device, Q1 2013 [TABLE]
Watching a video clip was the most popular activity, followed by checking for information on music, leisure or entertainment, and then playing an online game.
Read MoreYouTube vs. Vine Engagement Rates On Twitter, May 6 – June 5, 2013 [CHART]
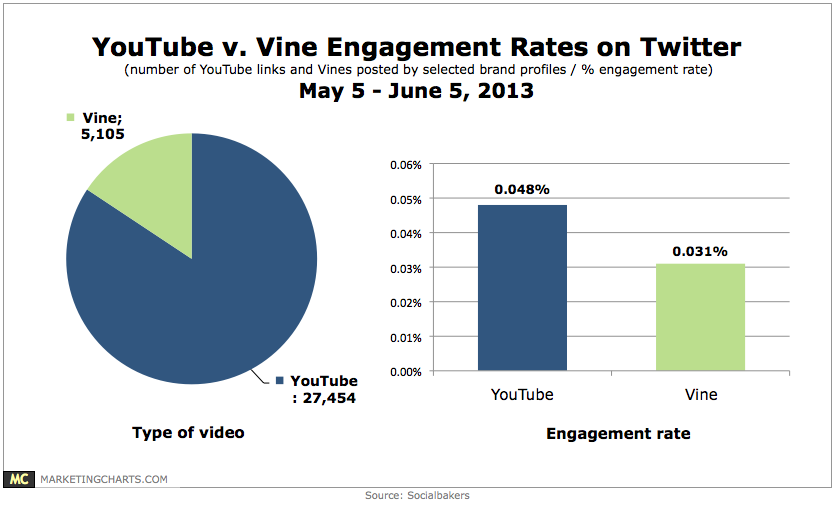
New data from Socialbakers indicates that tweets containing Vine uploads have a 0.031% engagement rate, not far behind tweeted YouTube videos’ rate of 0.048%.
Read MoreDevices College Students Own, June 2013 [CHART]

The average 18-34-year-old college student owns 7 tech devices (6.9 to be precise), up from 6.4 last year.
Read MoreGlobal Online Ad Spending Forecast By Format, 2013 [CHART]
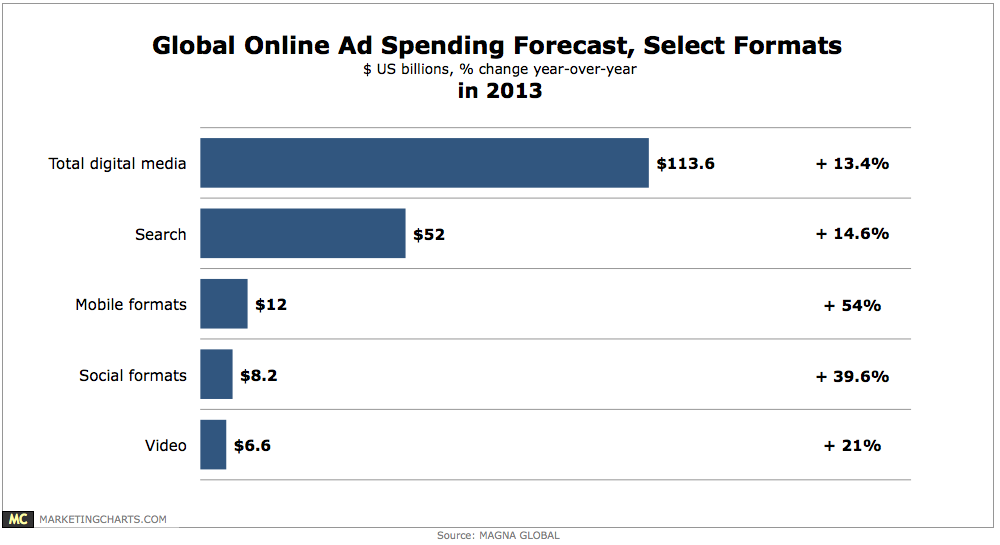
Online ad spending around the world is projected to grow by 13.4% to reach $113.6 billion this year.
Read MoreConsumer Attitude Toward Ads On TV vs Original Streaming Video, January 2013 [CHART]
45% of consumers have a negative attitude to digital video ads vs. 39% who had negative opinions of ads shown on TV.
Read MoreFactors Influencing Digital Video Spending, April 2013 [CHART]
73% of respondents saying better targeting would affect how much more they would spend on digital video.
Read MoreDigital Video vs. TV For Awareness & Engagement, April 2013 [CHART]

Almost three-quarters of marketing professionals worldwide planned to increase their spending on branded video content or video ads in the next year.
Read MoreExpectation & Tolerance For Mobile Video Ads, June 2013 [CHART]
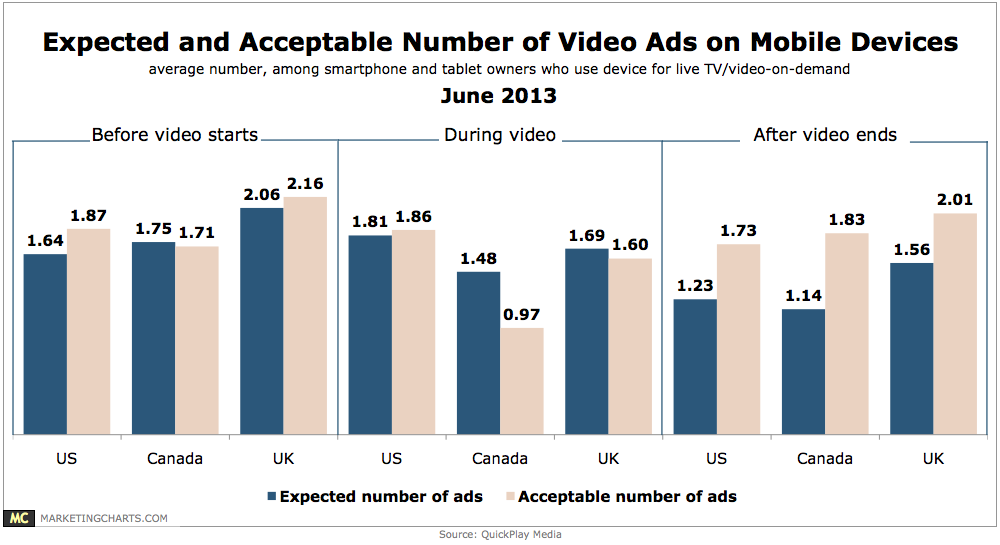
Research from comScore has shown that the average TV show is about one-quarter ads, while new figures from comScore indicate that online video ads accounted for just 2.6% of all minutes spent watching online video last month.
Read MoreOnline Video Ad Views, December 2011 – May 2013 [CHART]
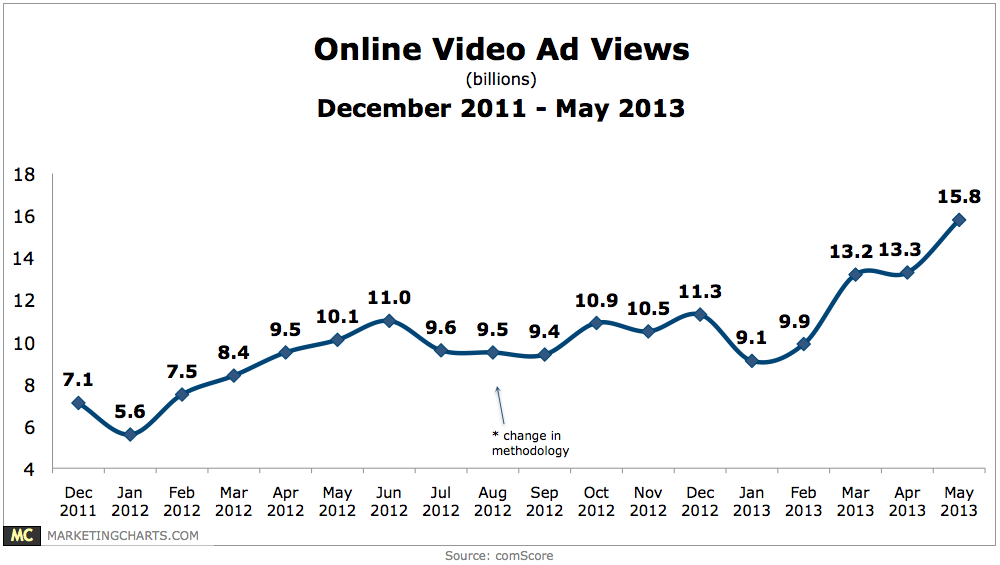
In May, Americans watched an average of 96.5 ads each, up significantly from 81.6 the prior month.
Read MoreReach & Frequency Of Video Ads, January – May 2013 [CHART]
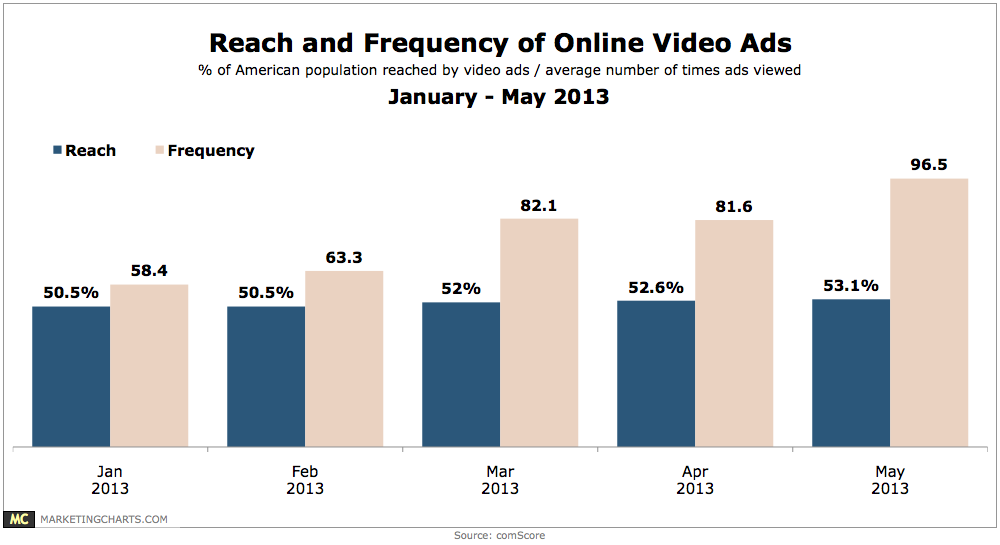
About 53% of the US population watched online video ads in May, relatively unchanged from April’s 52.6%.
Read More