Video Marketing
Smart Phone Online Video Ad Shares By Manufacturer, September 2013 [CHART]
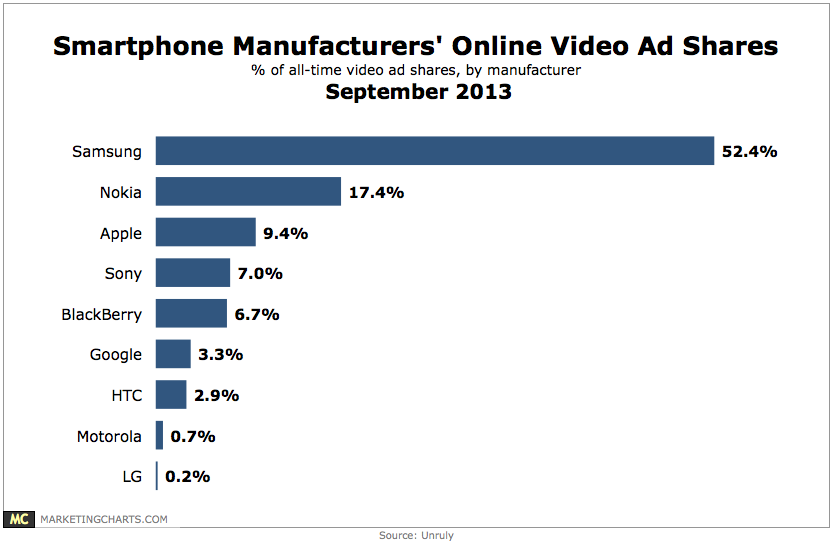
Apple may be the top smartphone manufacturer in the US, but it’s far behind Samsung when it comes to sharing of its video ads.
Read MoreMost Desirable Future TV/Video Services & Options, September 2013 [CHART]
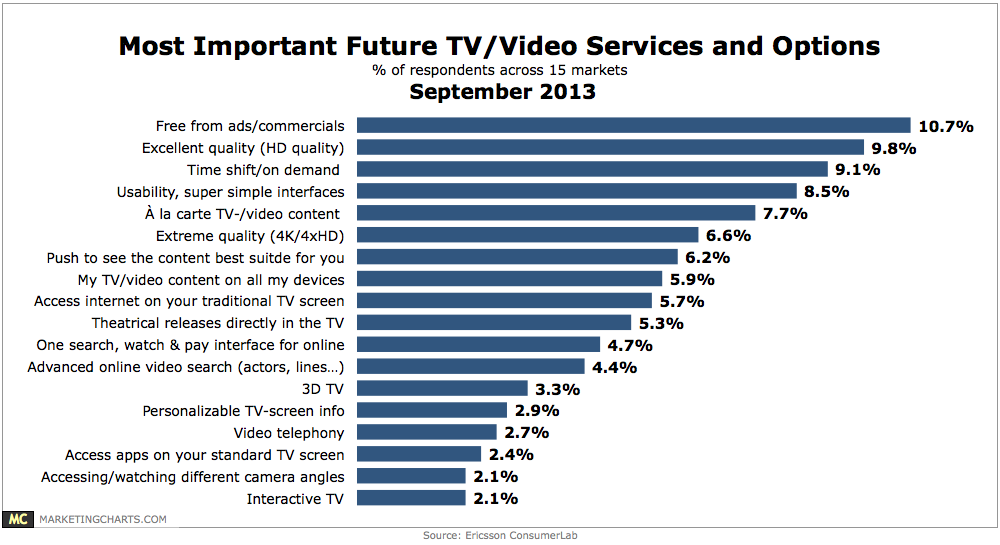
A leading 10.7% share of TV viewers from around the world said they want their future TV experience to be free of ads.
Read MoreGlobal IPTV Forecast, September 2013 [TABLE]
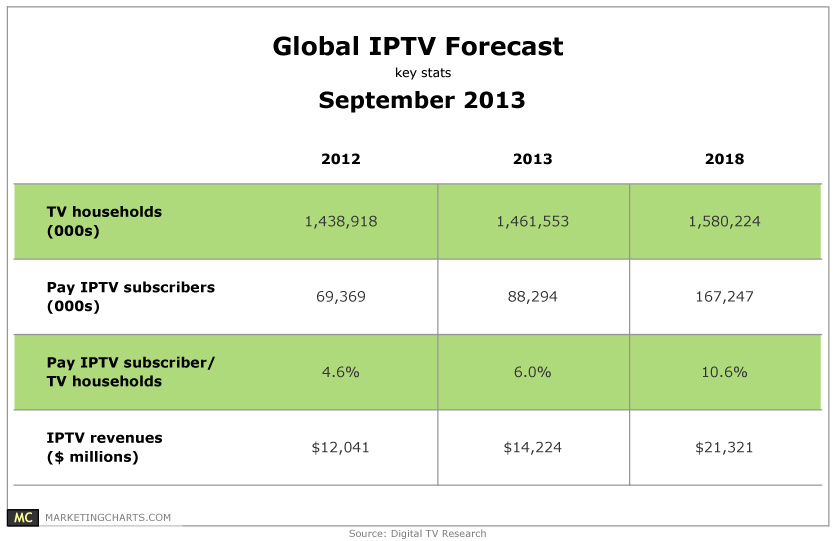
IPTV is forecast to continue its rapid penetration, set to reach 10.6% of TV homes by 2018, compared to 6% this year and 4.8% last year.
Read MoreFrequency With Which Americans Consume Streaming Video, July 2013 [TABLE]
35% of US Web users often or sometimes streamed video through a subscription service, such as Netflix.
Read MoreTypes Of Content American TV Viewers Watch During Primetime, May 2013 [CHART]
Live TV remained the most common type of content that TV viewers watched during primetime, with 67% doing so.
Read MoreVideo Streaming Frequency Of TV Viewers By Age, May 2013 [CHART]
More than half of 18- to 34-year-old respondents watched digital video or streamed digital content at least once a week.
Read MorePopular Second Screen Activities For TV Viewers, September 2013 [CHART]
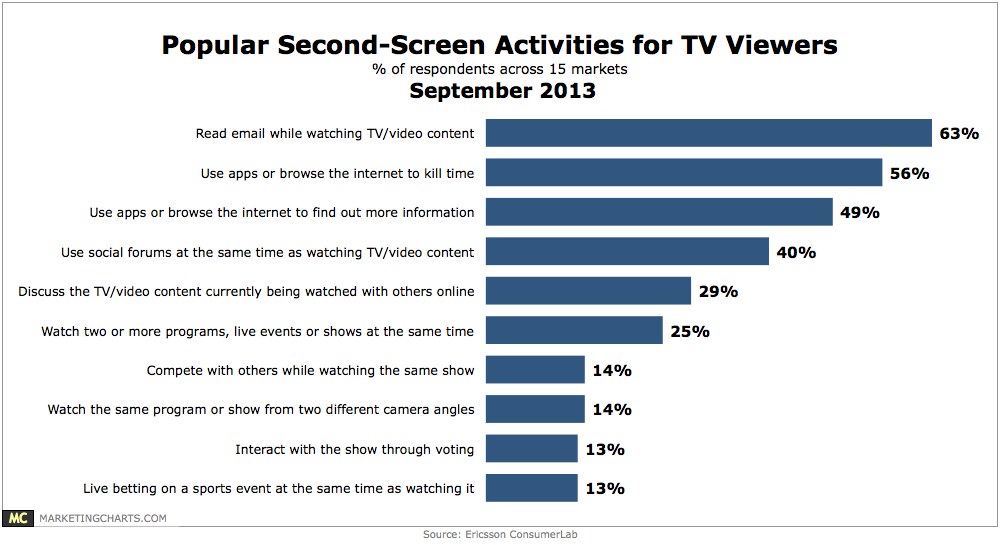
1 in every 4 TV viewers surveyed across a range of countries is using a second screen to watch 2 or more programs, live events, or shows at the same time.
Read MoreTop 10 Smart Phone Applications, Q2 2013 [VIDEO]
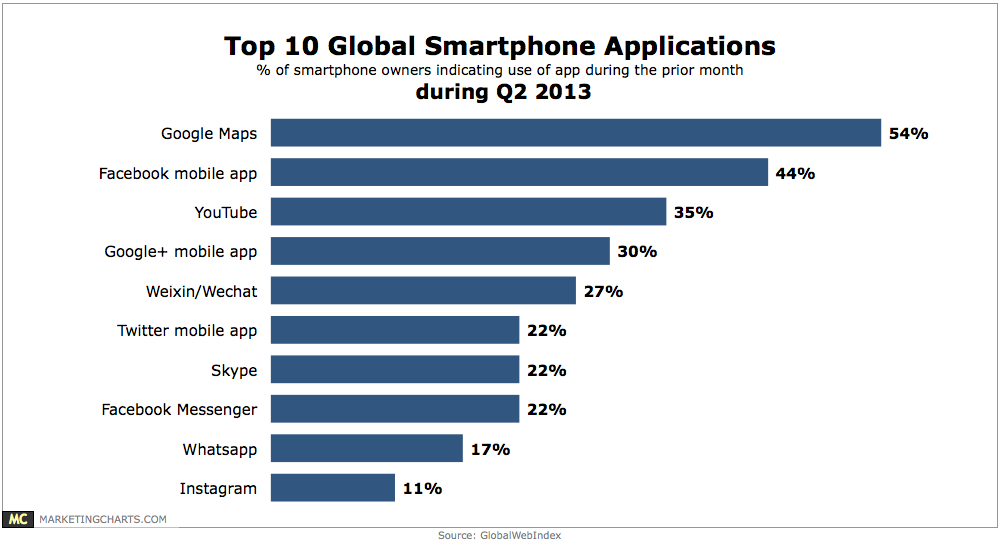
Despite having a highly engaged mobile user base, Twitter falls behind Google+ in mobile application popularity around the world.
Read MoreOnline Video Ad Viewability Averages By Source, Q1 2013 [CHART]
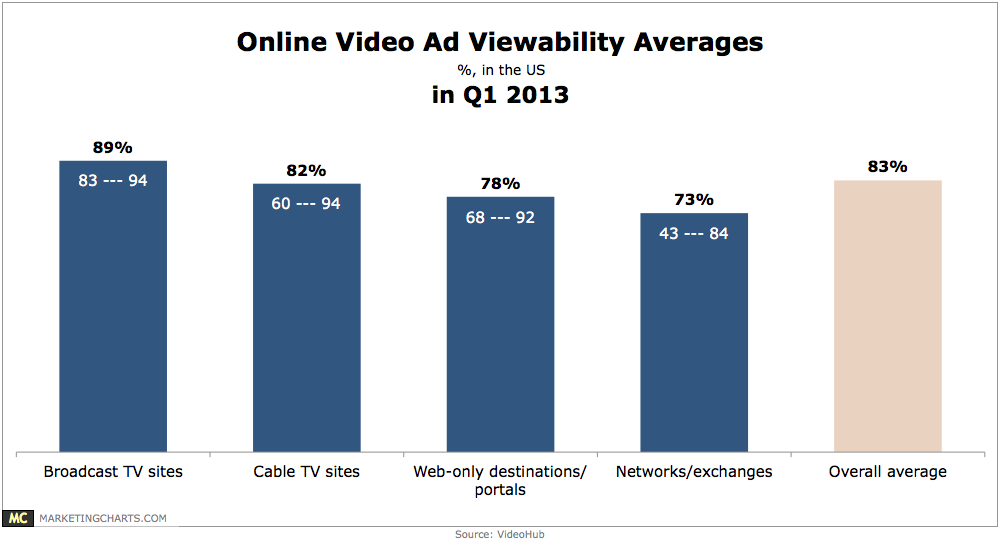
During the first quarter, average viewability for online video ads in the US was 83%, although rates varied widely among properties.
Read MoreUS Online Display Ad Spending Share By Format, 2011-2017 [CHART]
eMarketer estimates that video’s share of the overall digital display budget will rise from 23.4% this year to 30.7% by 2017.
Read More