Video Marketing
Parents' Mobile Content Activities, August 2013 [TABLE]
Nearly seven out of 10 parents in the survey owned a smart phone, 44% had a tablet and 21% an eReader.
Read MorePopular Mobile Phone Activities, May 2013 [CHART]
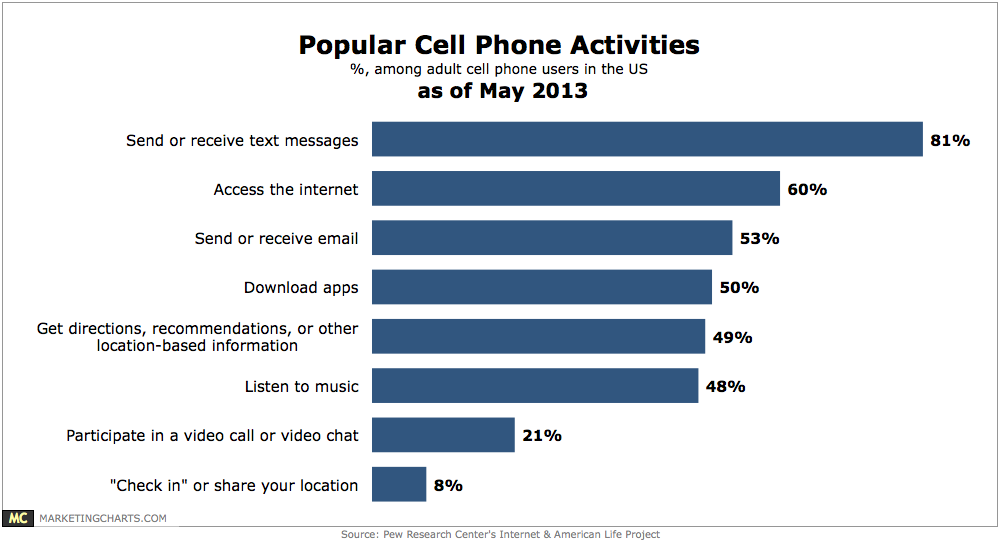
9 in 10 American adults own a cell phone as of May, and these adults are using their phones for a variety of activities other than voice calls.
Read MoreReach & Frequency Of Video Ads, January – August 2013 [CHART]
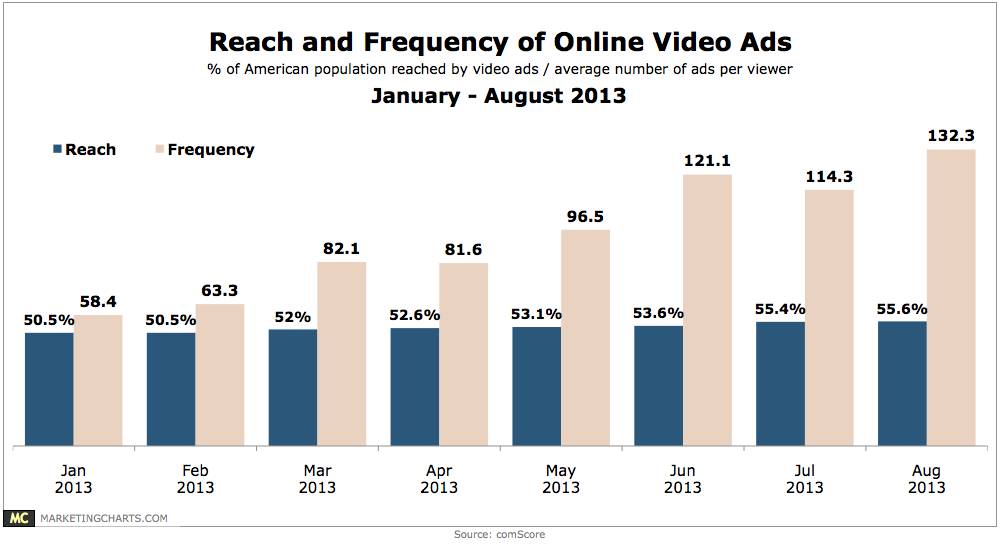
In August, the average viewer saw 132 ads, besting the previous high of 121 set in June, and more than doubling January’s average of 58.
Read MoreOnline Video Ad Views, December 2011 – August 2013 [CHART]
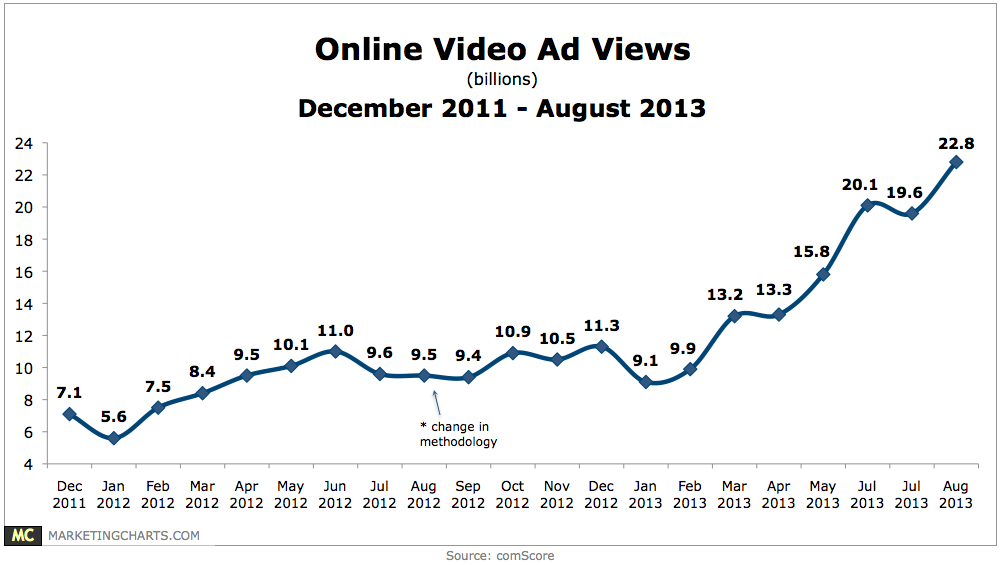
Online video ad views have been increasing rapidly this year, reaching a new high of 22.8 billion in August after a slight dip in July.
Read MoreCable TV Subscriber Attitudes, September 2013 [TABLE]
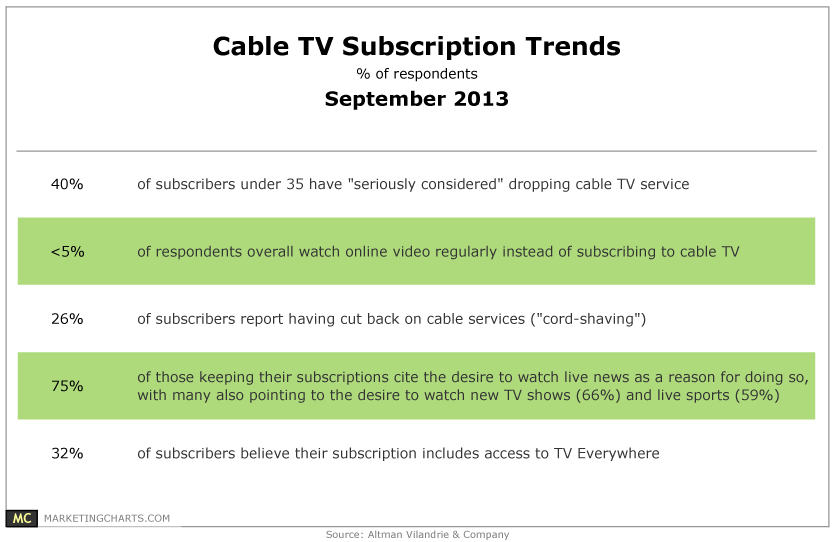
The number of TV cord-cutters has been rising more quickly than expected of late, but represented only about 1% of pay-TV subscribers last year.
Read MoreTime Using Tablets By Activity, September 2013 [CHART]
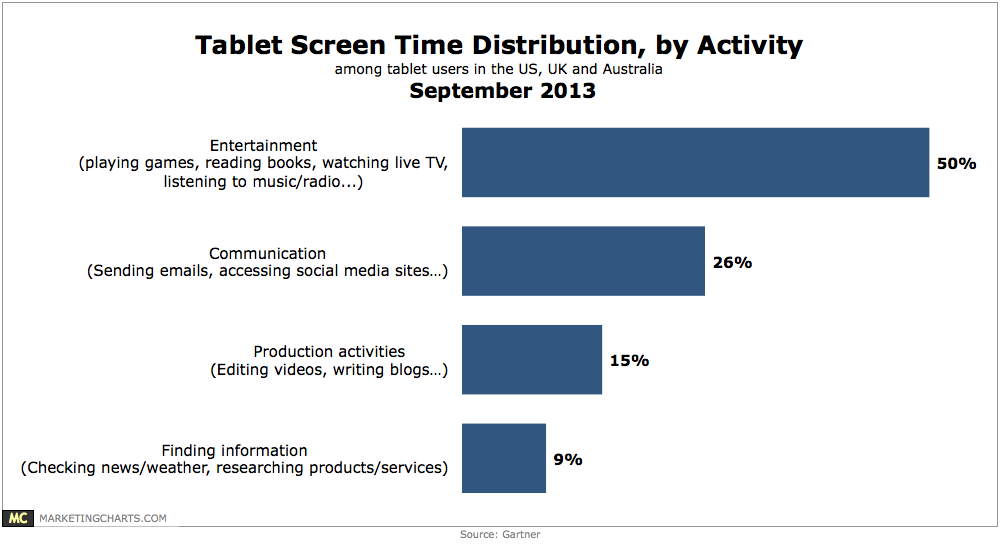
Tablet owners spend half of their device time with entertainment activities such as playing games, reading books, watching live TV or listening to music and radio.
Read MoreB2B Social Media Tactics, 2011-2013 [TABLE]
Eighty-four percent of B2B marketers used social networks this year, up from 79% in 2012, while both blogs and microblogs saw a decline in B2B use this year.
Read MoreTop Types Of Content Shared On Social Media Sites, September 2013 [CHART]
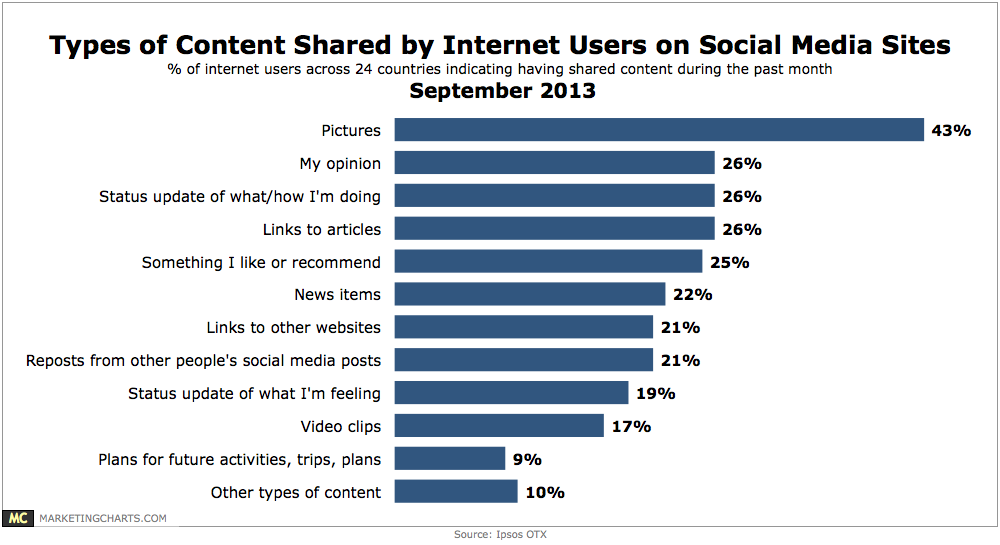
7 in 10 internet users across 24 countries say they’ve shared some type of content on social media sites in the past month.
Read More
Online Video Ad Metrics By Size, Q1 2013 [TABLE]
The larger the video ad, the higher the completion rate, with a 93.0% completion rate for extra-large video ads vs. a 66.0% completion for extra-small video ads.
Read More