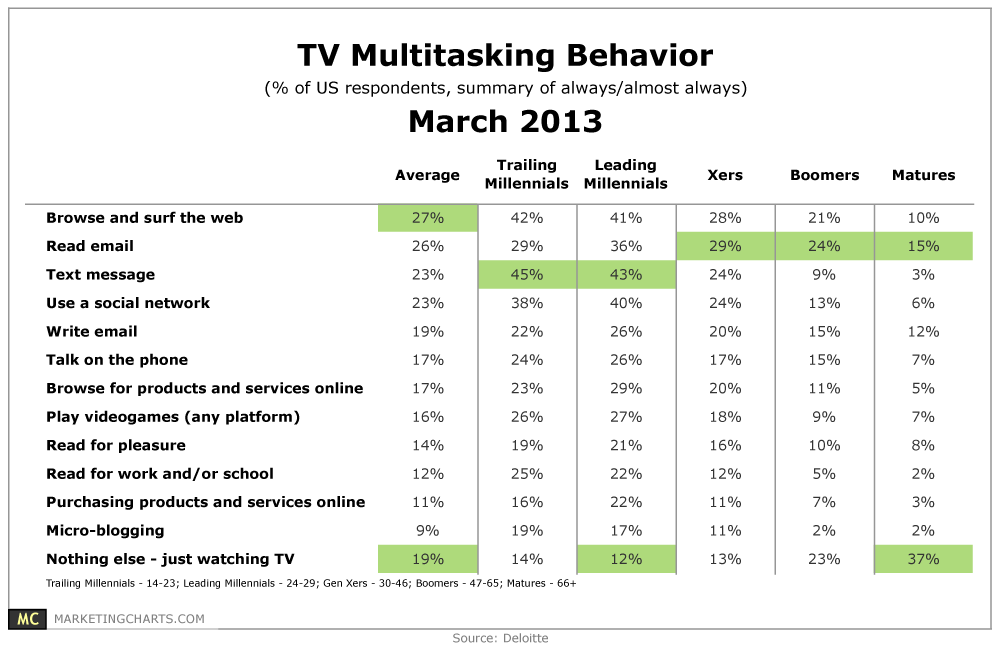
Video Games
Second Screen TV-Related Behavior, April 2013 [CHART]
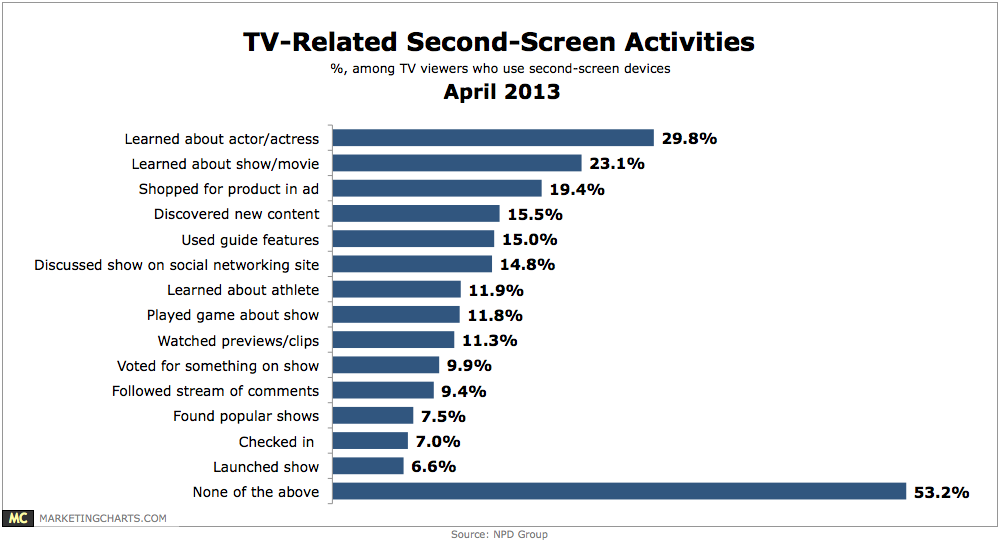
Among the most common is shopping for a product seen in an ad, by 19.4% of TV watchers who engage in second-screen activities.
Read MoreDevices Use For Multitainment, 2012 vs 2013 [CHART]
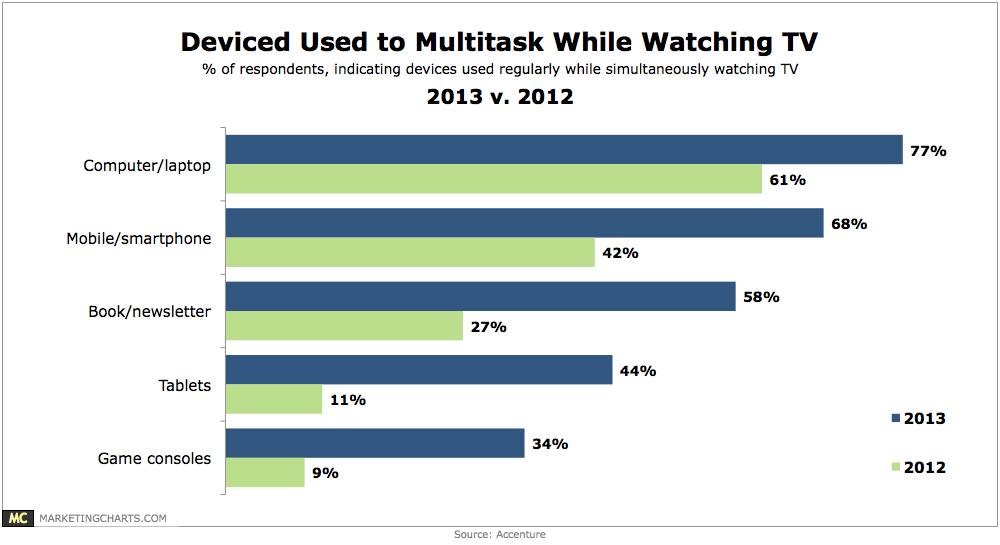
Regular use of tablets while watching TV (on a TV set) has soared from 11% in 2012 to 44% this year.
Read MoreAmerican & Retail Therapy, April 2013 [TABLE]
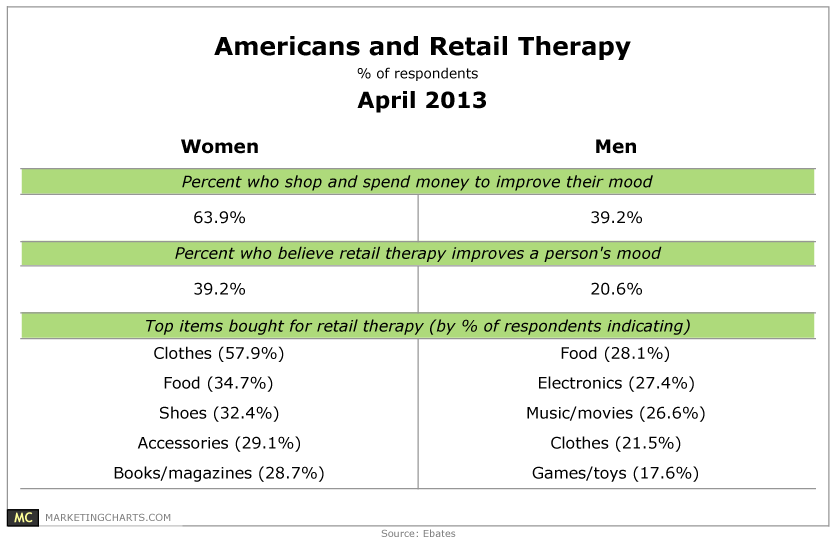
American women are 61% more likely than men to say they shop and spend money to improve their mood.
Read MoreCore Gamers' Likelihood Of Buying New Console At Release, January 2013 [CHART]
29% of core gamers indicated a willingness to buy a next-generation console soon after its release.
Read MoreUS Core Gamers Who Buy Physical vs Digital Games, January 2013 [CHART]
Almost eight in 10 core gamers indicated that they were much more likely to purchase a physical media game over a digital game.
Read MoreMobile Device Use By Activity & Device Size, February 2013 [CHART]
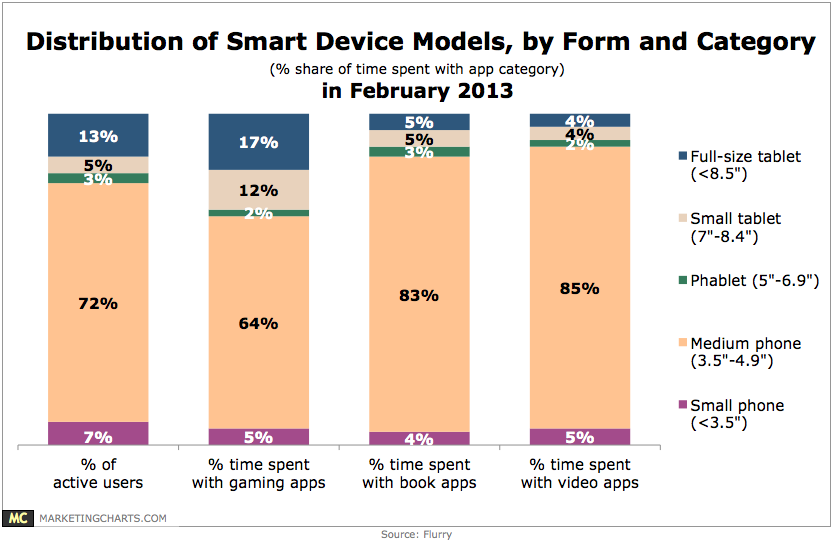
While small (5%) and full-size (13%) tablets accounted for less than 20% of active smart device users around the world, they represented 29% of time spent playing gaming applications on such devices in February 2013.
Read MoreAmericans Most Valuable Household Services By Generation, March 2013 [TABLE]
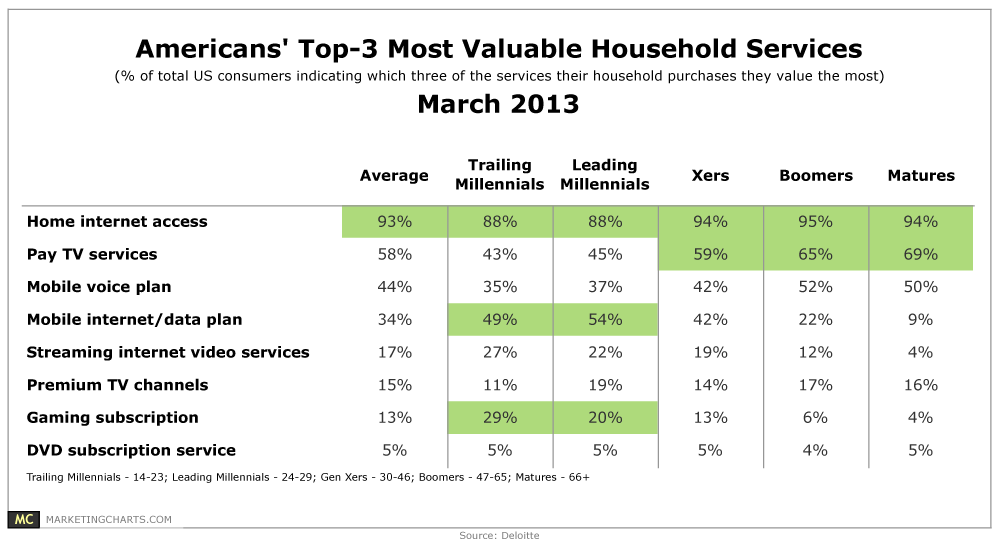
Young people are wedded to their mobile phones, and as a new survey from Deloitte shows, value their mobile data plans more than their pay TV services.
Read MoreVideo Consumption By Platform & Generation, Q4 2012 [TABLE]
In Q4 2012, seniors averaged 220 hours and 55 minutes per month watching traditional TV.
Read MoreAmericans’ Favorite Media Activities By Generation, March 2013 [CHART]

64% of Americans rank watching TV (on any device) as one of their top-3 media activities, down from a high of 71% in 2009 and 2010 but enough to keep TV viewing as America’s favorite media activity.
Read More