Video Games
American Video Game Sales Revenues By Type, 2009-2012 [CHART]
Revenues from video game sales reached $14.8 billion last year.
Read MoreAmerican Video Gamers By Type, 2013 [CHART]
Just fewer than seven out of 10 US residents had ever played video or computer games.
Read MoreUS Video Gamers By Demographic, 2013 [CHART]
Women made up 45% of the gaming audience, and 68% of gamers were over the age of 18.
Read MoreDevices Used To Visit Social Media Sites By Gender, March 2013 [CHART]
The desktop and laptop remained the No. 1 place where users accessed sites, but the smart phone wasn’t far behind.
Read MoreSmart Phone Activity Share By OS, May 2013 [CHART]
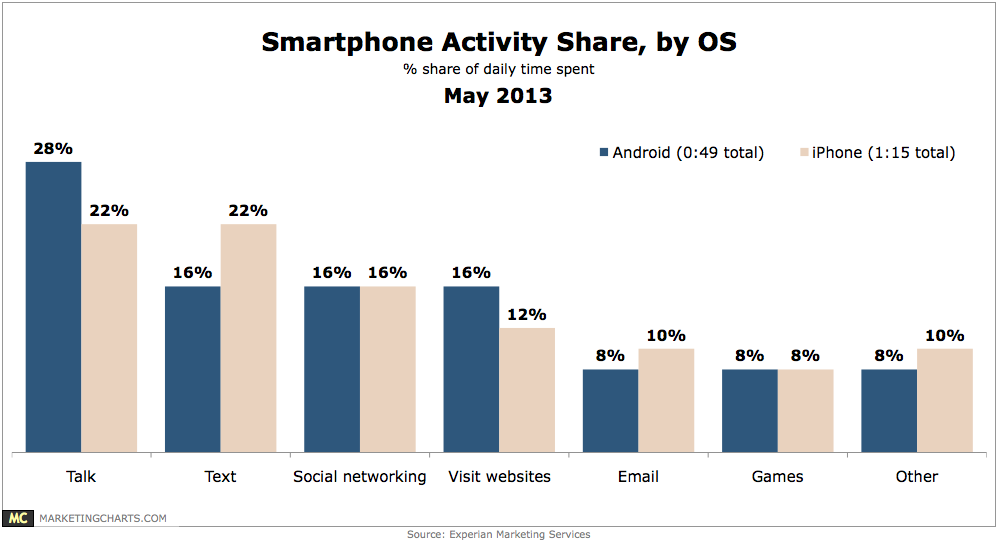
Americans spend about an hour each day on their smart phones (58 minutes to be exact).
Read MoreMoms' Social Sharing By Content Type, May 2013 [CHART]
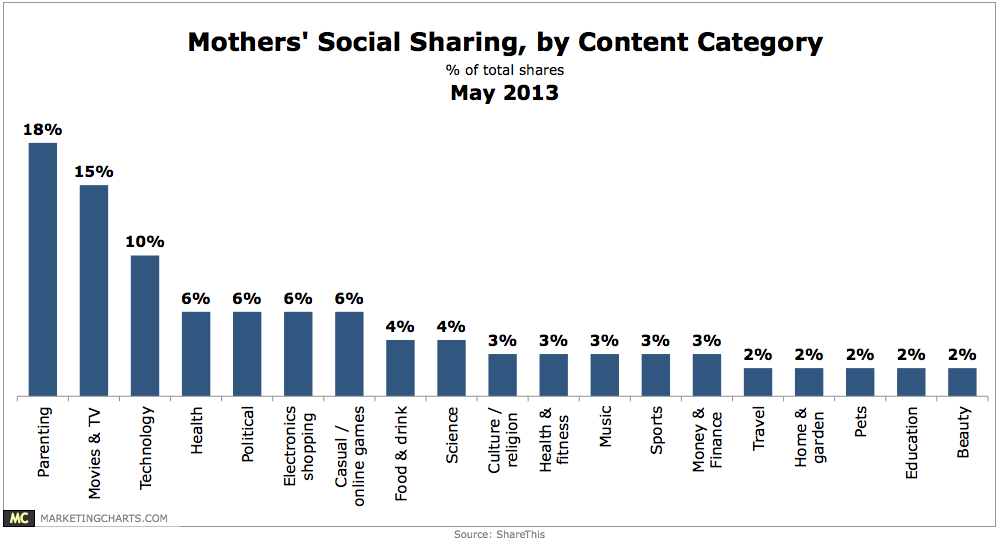
30% of mothers shared content on the ShareThis network during the period, compared to 10% of the network’s overall average.
Read MoreUS Mobile Phone Gamers, 2011-2017 [TABLE]
Double-digit mobile gaming growth rates will continue into 2015, when half of all US residents are expected to play games via their mobile phone at least once per month.
Read MoreUS Mobile Gaming Revenue Share By Type, 2011-2017 [CHART]
This year, the largest share of revenues will come from downloads of games themselves, with in-game purchases accounting for just slightly less.
Read MoreUS Mobile Gaming Revenues By Type, 2011-2017 [TABLE]
Mobile gaming has been a high-growth market in recent years, with revenues increasing at triple-digit rates in 2012 and 2011.
Read MoreHow Millennials Spend Their Free Time By Gender, May 2013 [CHART]

58% of Millennial men said they watch TV, with about 4 in 10 saying they listen to or play music.
Read More