Video Games
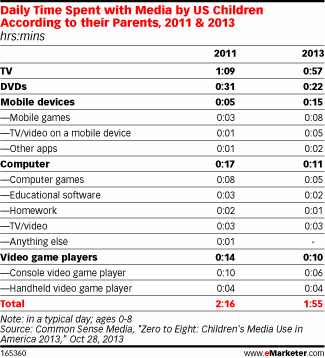
Generation V's Daily Time Spent With Media By Device, 2011 & 2013 [TABLE]
Younger children are spending less time overall in front of screens, according to an October 2013 survey of US parents with kids ages 8 and younger.
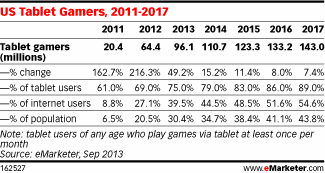
Read MoreUS Tablet Gamers, 2011-2017 [TABLE]
Three-quarters of tablet users will play games regularly on such a device.
Read MoreHR Technology Trends [INFOGRAPHIC]
This infographic by Spark Hire illustrates some HR technology trends.
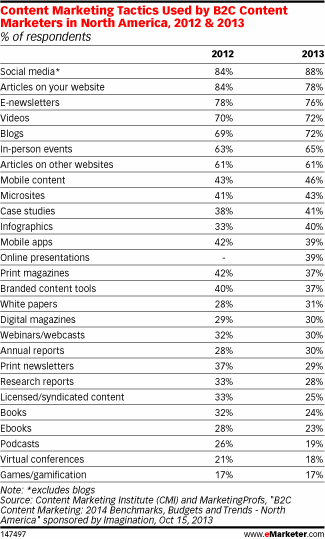
Read MoreTop B2C Content Marketing Tactics, 2012 & 2013 [TABLE]
The overwhelming majority of respondents—90%—had used content marketing in 2013, compared with 86% of companies who did so the year before.
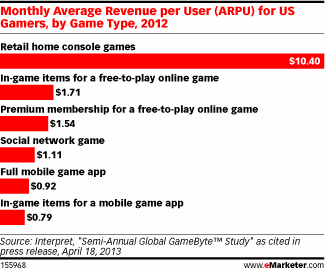
Read MoreMonthly Average Video Game Revenue Per User By Game Type, 2012 [CHART]
Although mobile games are a growing category, they also generate less average revenue per user than other forms of gaming.
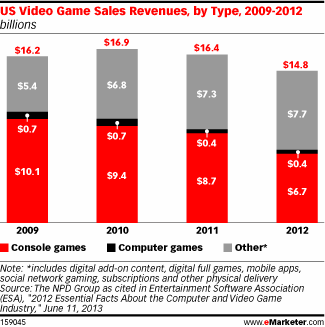
Read MoreUS Video Game Revenues By Type, 2009-2012 [CHART]
In 2012, the “other” video game category grew to $7.7 billion, up from $5.4 billion in 2009.
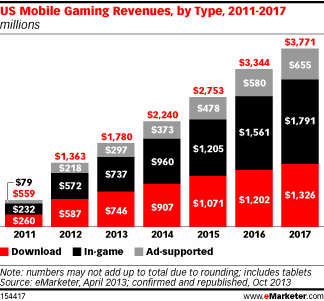
Read MoreUS Mobile Gaming Revenues By Type, 2011-2017 [CHART]
eMarketer estimates the number of US mobile phone gamers will reach 125.9 million in 2013.
Read MoreBurger King Rebranding, Chipotle's Attack On Big Food & A Major League Twitter Rant – Beyond Social Media Show [VIDEO]
Topics on episode 19 of the Beyond Social Media Show: Burger King rebrands as Fries King; Chipotle attacks Big Food, MLB Pitcher attacks Twitter critics; BlendTec destroys iPhones & more!
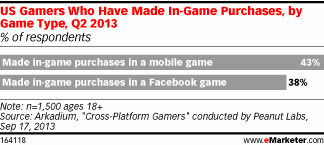
Read MoreAmerican Gamers Who Have Made In-Game Purchases By Game Type, Q2 2013 [CHART]
More than one-quarter of US web users reported having purchased through an app store a game that could be played via any device.
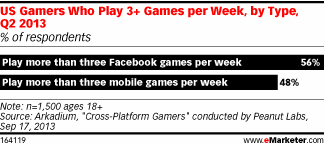
Read MoreGamers Who Play More Than 3 Games Per Week By Type, Q2 2013 [CHART]
More than half of adult US gamers played more than three Facebook games per week, and just fewer than half played at least that many mobile games.
Read More