Video Advertising
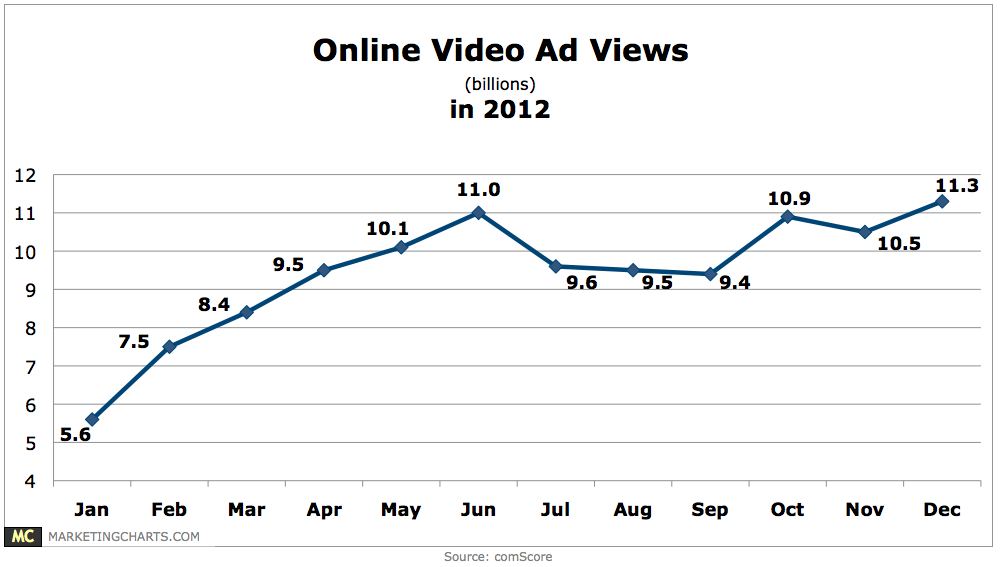
Online Video Advertising Views, 2012 [CHART]
Americans watched 11.3 billion video ads in December, setting a new peak, and a sharp 10% rise from November’s 10.3 billion.
Read More92% Of Consumers Share Mobile Video Clips [PIC]
63 percent of digital video screening on mobile phones does not happen on-the-go, but rather at home.
Read MoreOnline Video Ad Views, January – November 2012 [CHART]
Americans watched 10.5 billion video ads in November, down slightly after October’s spike of 10.9 billion, but still fairly steady after a summer lull.
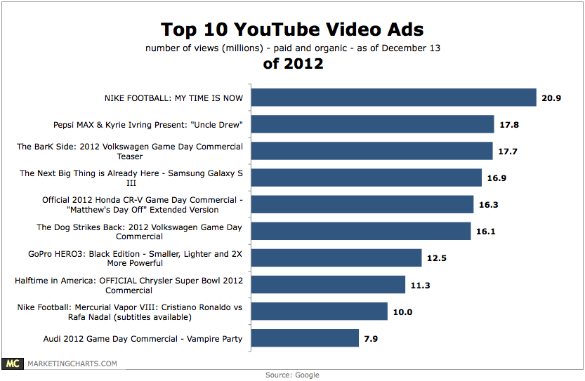
Read MoreTop 10 YouTube Video Ads Of 2012 [LIST]
Google’s list of top YouTube ads (in terms of total views) features a mix of sports, automotive, and tech brands.
Read MoreBranding Effectiveness From Pre-Roll Video Ads, December 2012 [CHART]
Viewers exposed to a pre-roll video ad demonstrated higher brand awareness and message association than a control group that did not watch the ad.
Read MoreMobile Device Users Attitudes Toward Ads By Medium, November 2012 [CHART]
Smart phone and tablet owners may love their devices, but they’re not all that fond of advertising on them.
Read MoreMost-Shared Social Video Brands Of 2012 [INFOGRAPHIC]
This infographic by Unruly lists the brands with the most social videos of 2012.
Read MoreVideo Ad Completion Rates By Video Length, Q1 2011 – Q3 2012 [CHART]
Ads placed in long-form videos of 20+ minutes continue drawing higher completion rates.
Read MoreOnline Video Ad Views, January – September 2012 [CHART]
Google Sites, driven chiefly by YouTube.com, was the top online video content property in September with 150.3 million unique viewers.
Read More


