Video Advertising
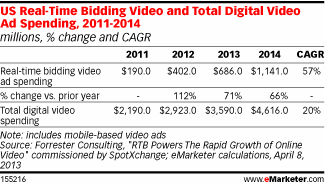
American Real-Time Bidding & Video Ad Spending, 2011-2014 [TABLE]
Between 2011 and 2014, RTB video spending will also grow at nearly three times the rate of overall video spending, rising at a compound annual growth (CAGR) rate of 57% vs. 20% for video overall.
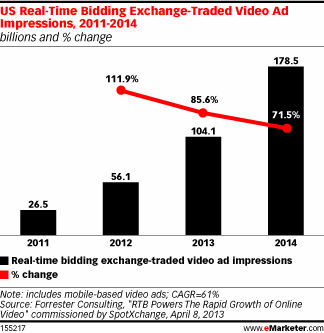
Read MoreUS Real-Time Bidding & Video Ad Impressions, 2011-2014 [CHART]
In 2012 the number of video ad impressions bought via RTB exchanges doubled year over year; this year, the number of video impressions will top 100 billion.
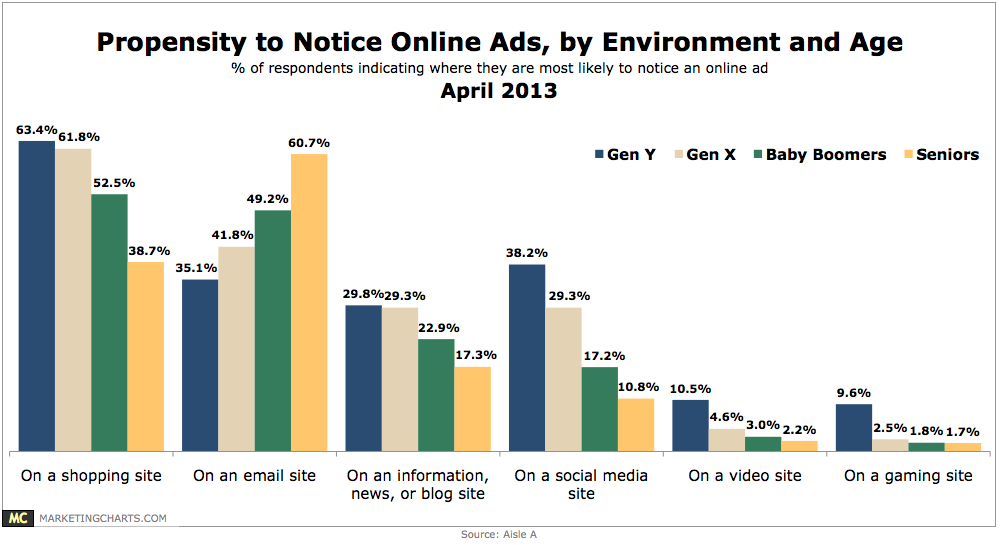
Read MoreAd Awareness By Generation & Context, April 2013 [CHART]
About half of consumers often (18.2%) or sometimes (33%) pay attention to online ads.
Read MoreCompletion Rates By Length Of Mobile Rich Media Video Ads, April 2013 [CHART]
Completion rates for very short videos (less than 30 seconds) had the lowest completion rate (35.8%), behind even the longest ads (150 seconds and longer), which had a roughly 50% completion rate.
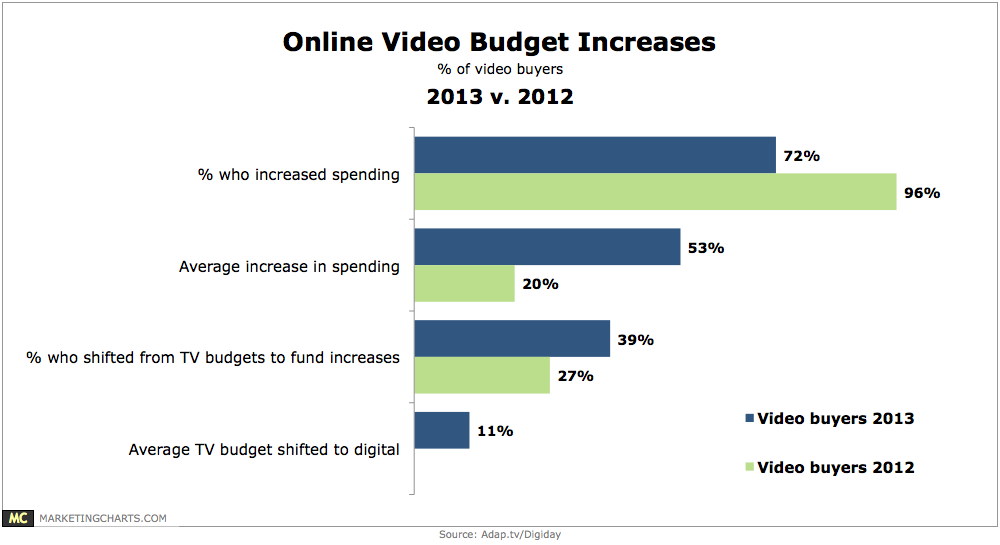
Read MoreBudget Increases For Online Video, 2012 vs 2013 [CHART]
A recent study by Nielsen and the IAB recommended moving 15% of TV budgets to online video in order to increase reach at a lower cost.
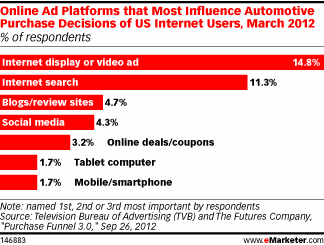
Read MoreMost Influential Ad Platforms For Automotive Purchase Decisions, March 2012 [CHART]
55% of respondents’ digital ad spending went to paid search engine marketing (SEM).
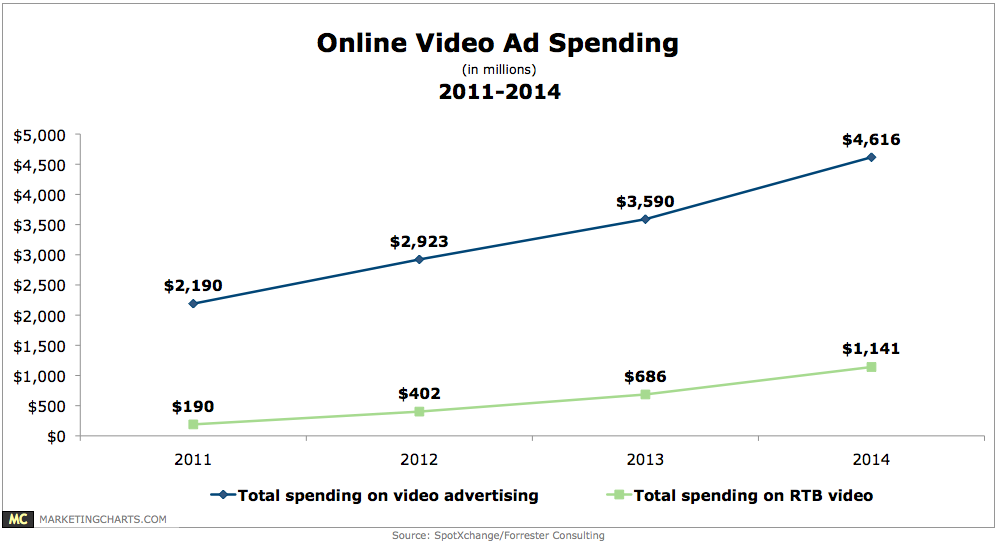
Read MoreOnline Video Ad Spending, 2011-2014 [CHART]
Total spending for real-time bidding (RTB) on video ads is estimated to grow by a compound annual rate of 57% between 2011 and 2014.
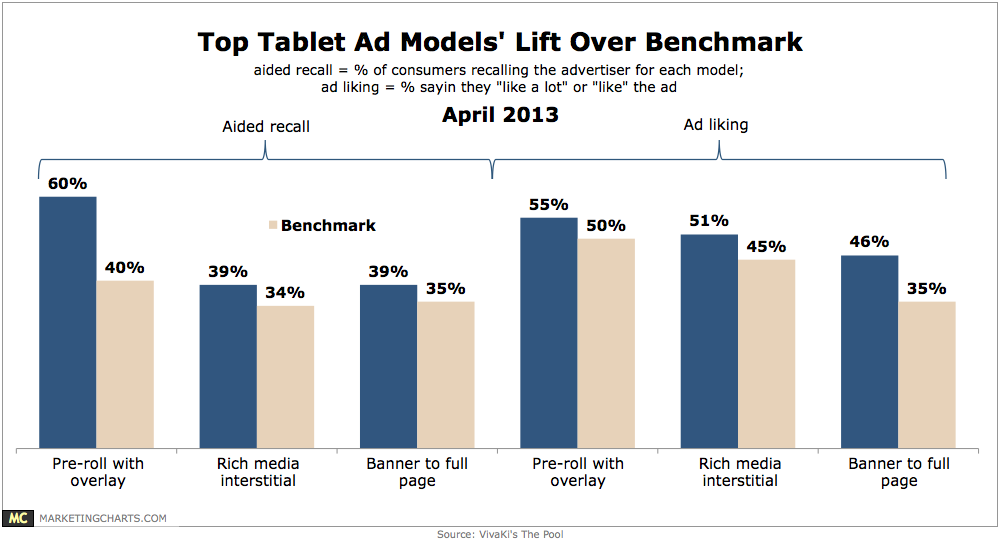
Read MoreTop Tablet Ad Models' Performance, April 2013 [CHART]
An exhaustive global study concludes that the top three tablet advertising models are pre-roll with overlay; rich media interstitial; and banner to full page rich media.
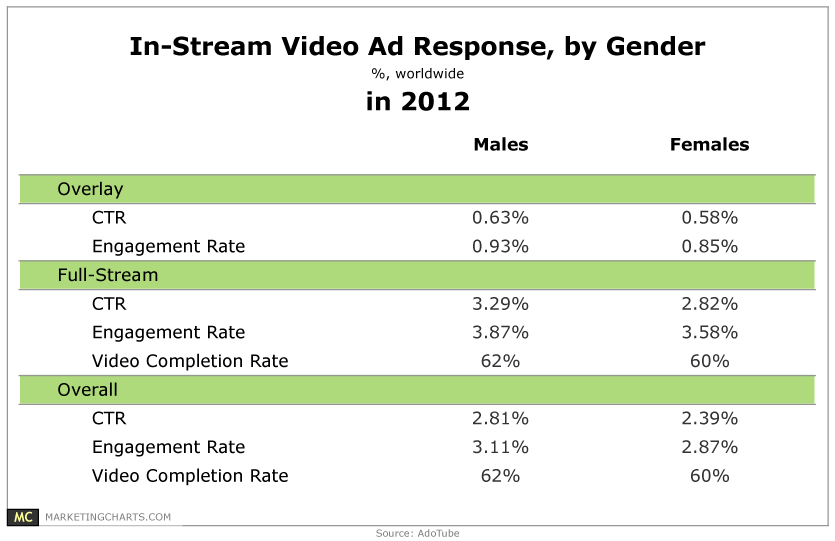
Read MoreIn-Stream Video Ad Response Rates By Gender, 2012 [TABLE]
Men responded more to in-stream video ads than women, with a 17.6% higher click-through rate (CTR; 2.81% vs. 2.39%).
Read More