Video Advertising
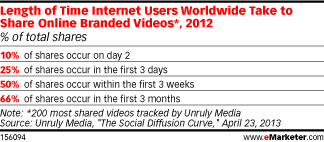
Time Delay For Sharing Online Branded Videos, 2012 [TABLE]
10% of total shares occurred on the second day after debut, the apparent high point for video ad sharing.
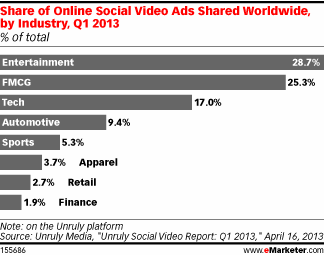
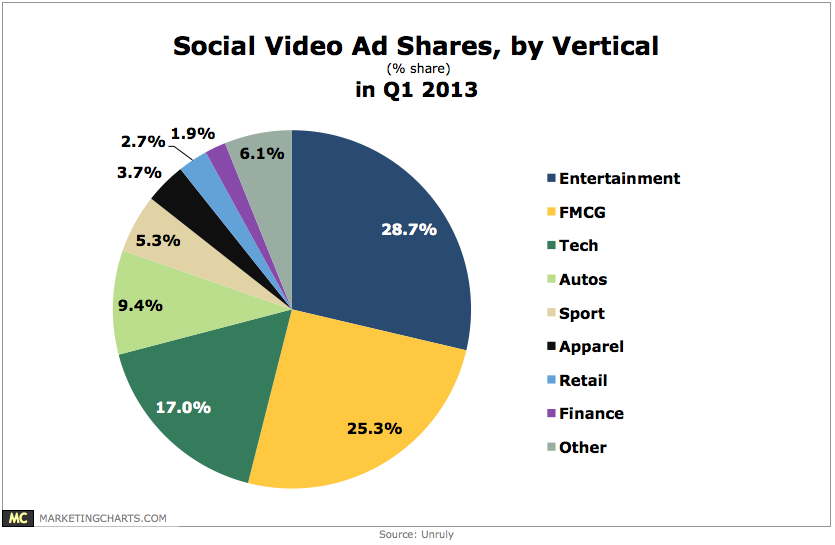
Read MoreOnline Social Video Ads Shared Worldwide By Industry, Q1 2013 [CHART]
Entertainment garnered the most social video shares in Q1 2013, which is unsurprising given the adeptness of the industry at creating video content.
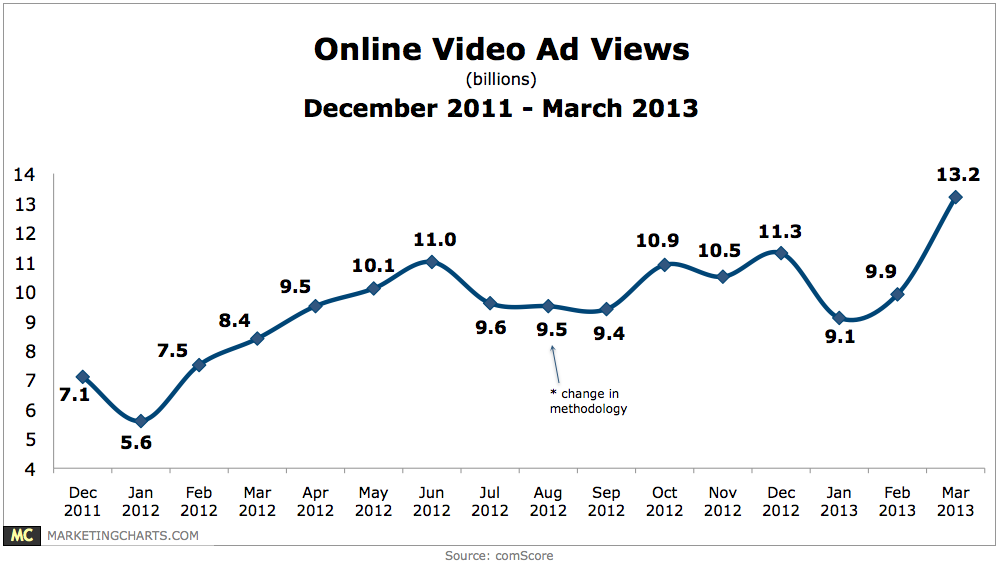
Read MoreOnline Video Ad Views, December 2011 – March 2013 [CHART]
Online video ad views jumped to a record high of 13.2 billion in March, up about 33% month-over-month.
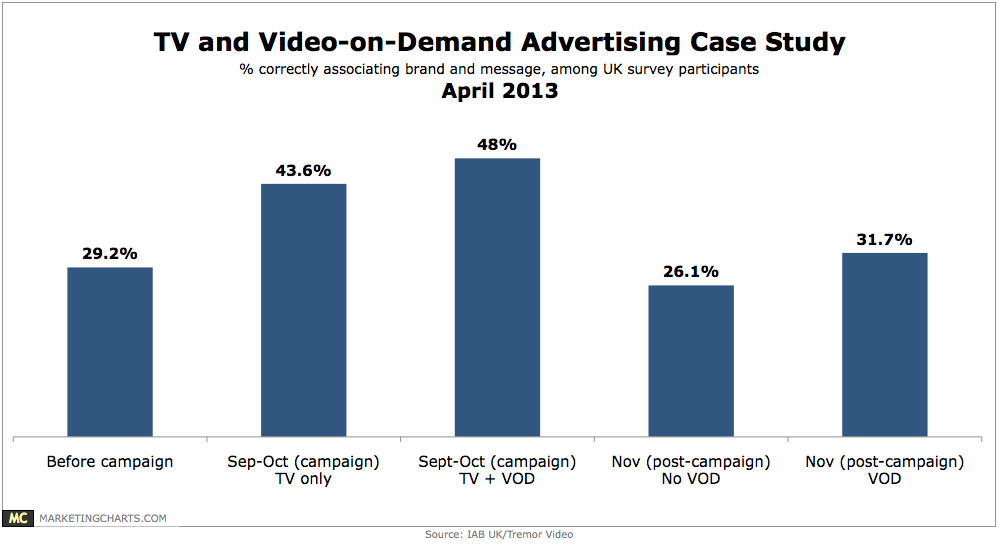
Read MoreVideo On Demand Advertising, April 2013 [CHART]
Video-on-demand campaigns can serve as an effective complement to TV advertising, increasing both brand awareness and message association.
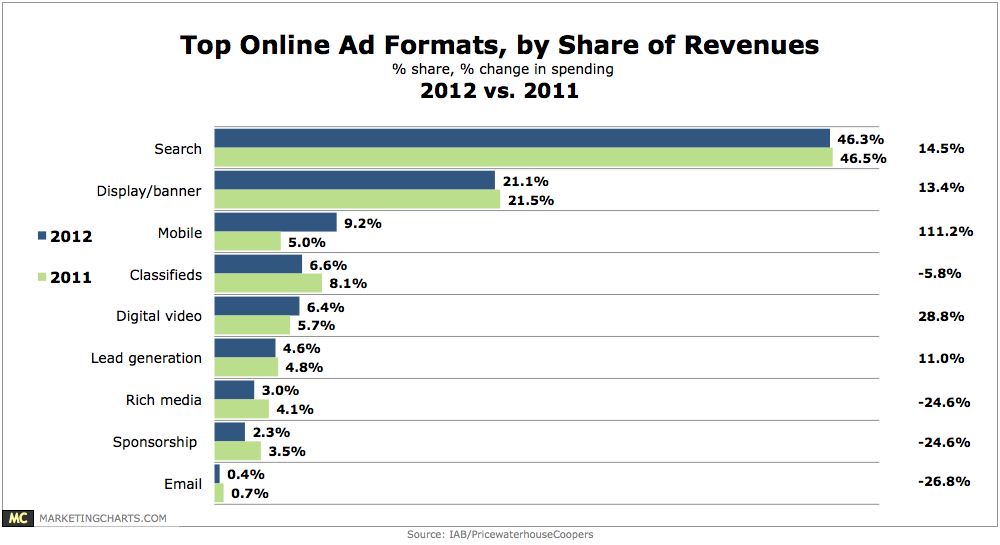
Read MoreTop Online Ad Formats By Share Of Revenue, 2011 vs 2012 [CHART]
Online ad revenues grew by 15% year-over-year in 2012.
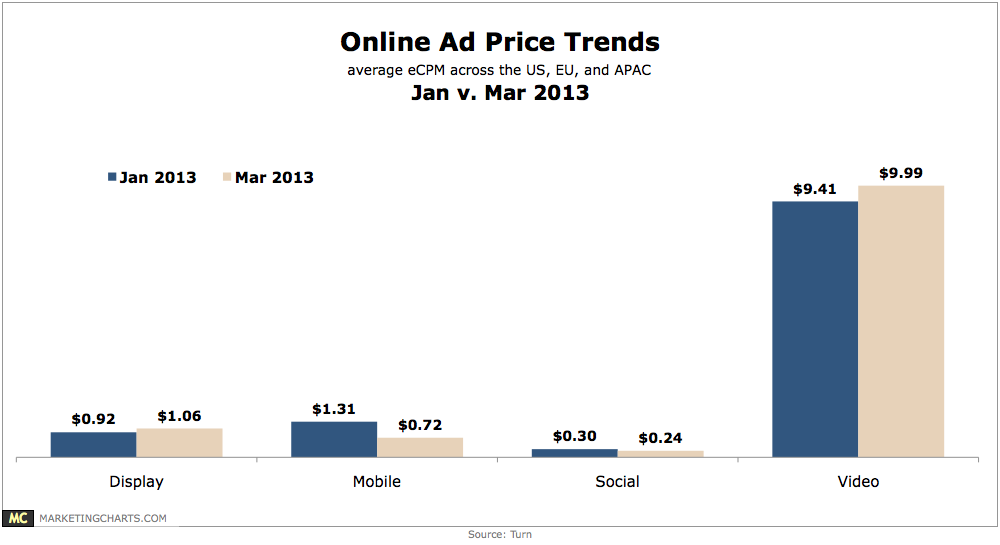
Read MoreOnline Ad Price Trends By Ad Type, January vs March 2013 [CHART]
Average video eCPMs increased 6.2% between January and March 2013, from $9.41 to $9.99, while display ad prices grew by 15.2% from $0.92 to $1.06.
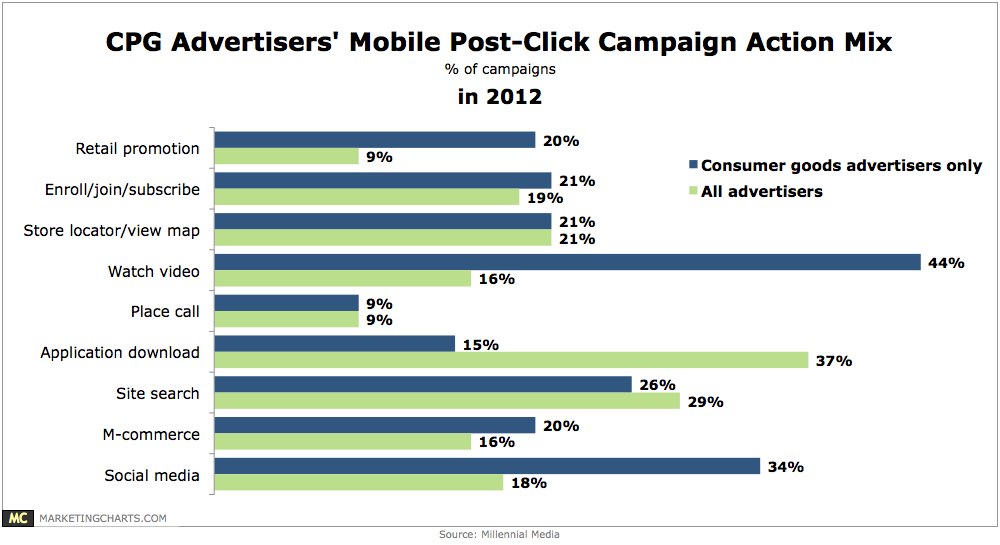
Read MoreCPG Mobile Advertising Post-Click Actions, 2012 [CHART]
CPG brands were more focused on encouraging consumers to watch video, with 44% of the campaigns incorporating a video aspect (compared to 16% on average).
Read MoreSocial Video Advertising Shares By Industry, Q1 2013 [CHART]
Fast-moving consumer goods ad campaigns generated almost 8.7 million shares during the quarter, up 78.2% from Q4 2012, and representing 25.3% of all shares.
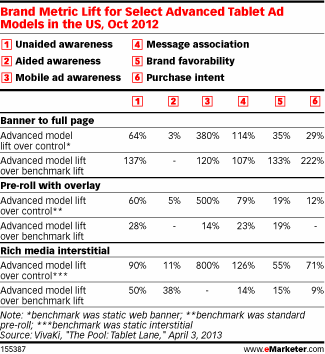
Read MoreBrand Lift Performance For Advanced Tablet Ads, October 2012 [TABLE]
The banner to full-page ad showed 380% greater mobile ad awareness over the control group who had not seen any ad.
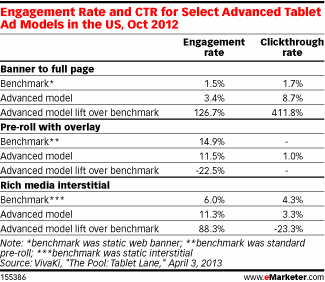
Read MoreEngagement & Click-Through Rates For Advanced Tablet Ads, October 2012 [TABLE]
At a clickthrough rate (CTR) of 8.7%, the banner to full-page ad’s clickthrough performance on tablets was more than four times greater than the static web banner.
Read More