Video Advertising
Expectation & Tolerance For Mobile Video Ads, June 2013 [CHART]
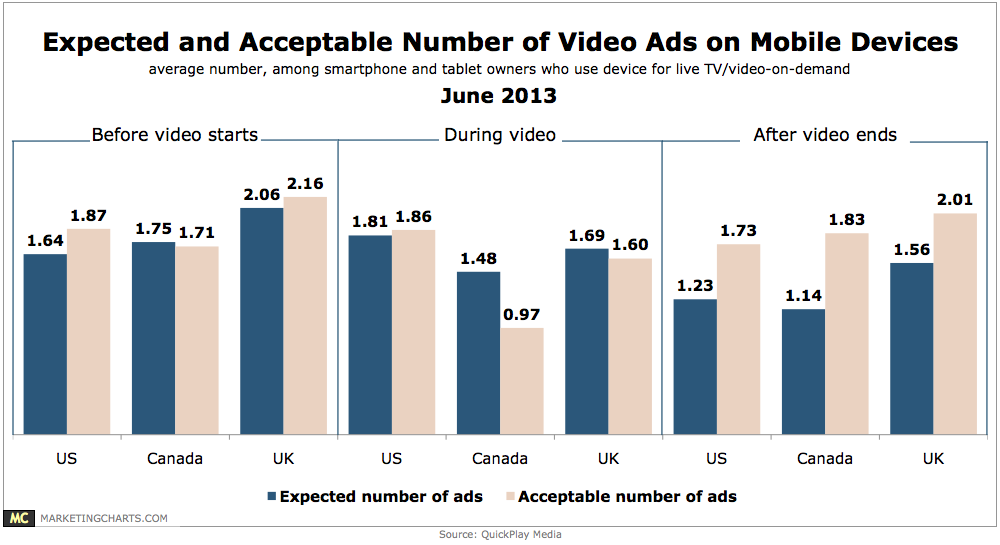
Research from comScore has shown that the average TV show is about one-quarter ads, while new figures from comScore indicate that online video ads accounted for just 2.6% of all minutes spent watching online video last month.
Read MoreOnline Video Ad Views, December 2011 – May 2013 [CHART]
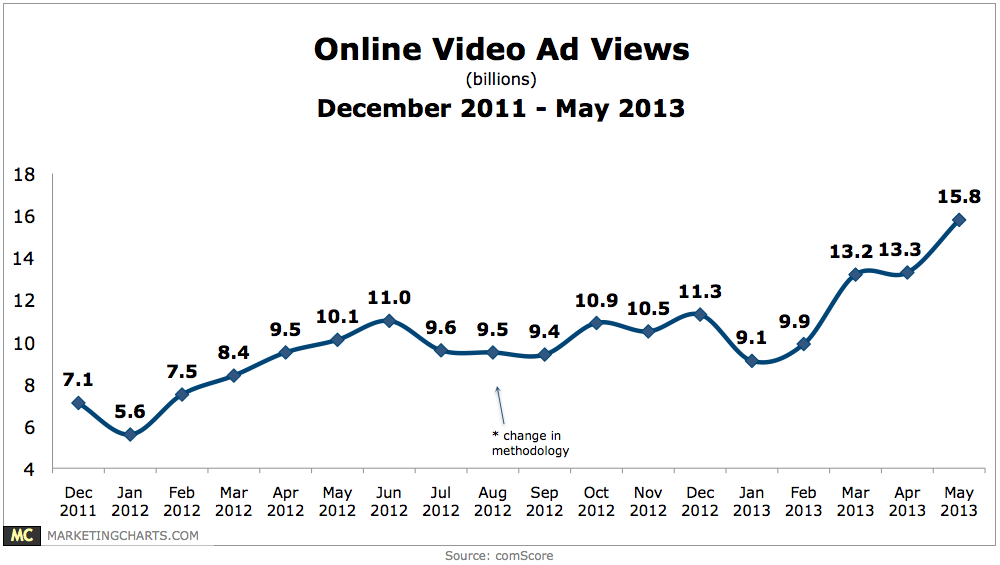
In May, Americans watched an average of 96.5 ads each, up significantly from 81.6 the prior month.
Read MoreReach & Frequency Of Video Ads, January – May 2013 [CHART]
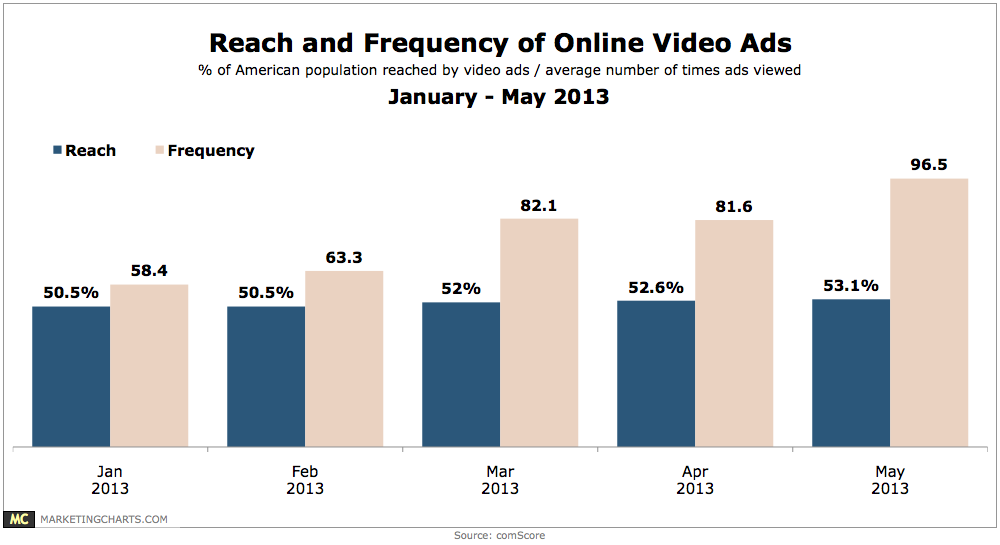
About 53% of the US population watched online video ads in May, relatively unchanged from April’s 52.6%.
Read MoreTop In-Stream Video Advertising Verticals, June 2013 [CHART]
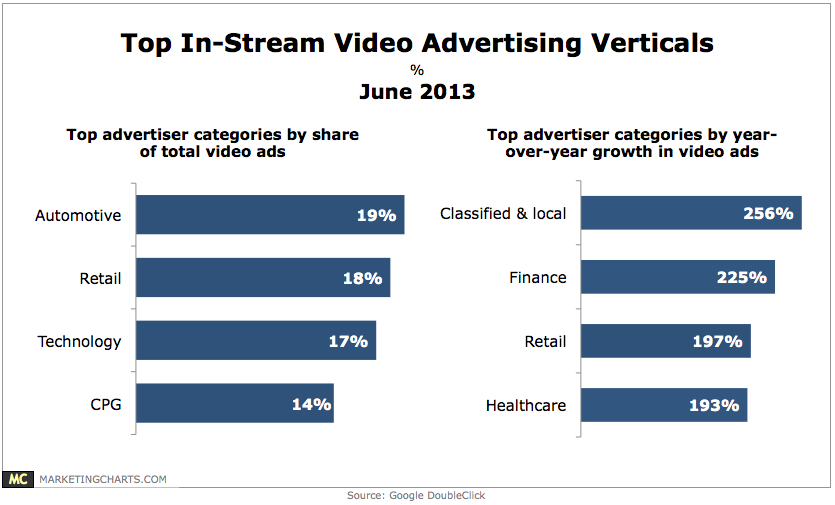
About 2 in 3 in-stream video ad impressions come from 4 advertiser categories.
Read MoreMarketing Effectiveness Of Online Video vs. TV, June 2013 [CHART]
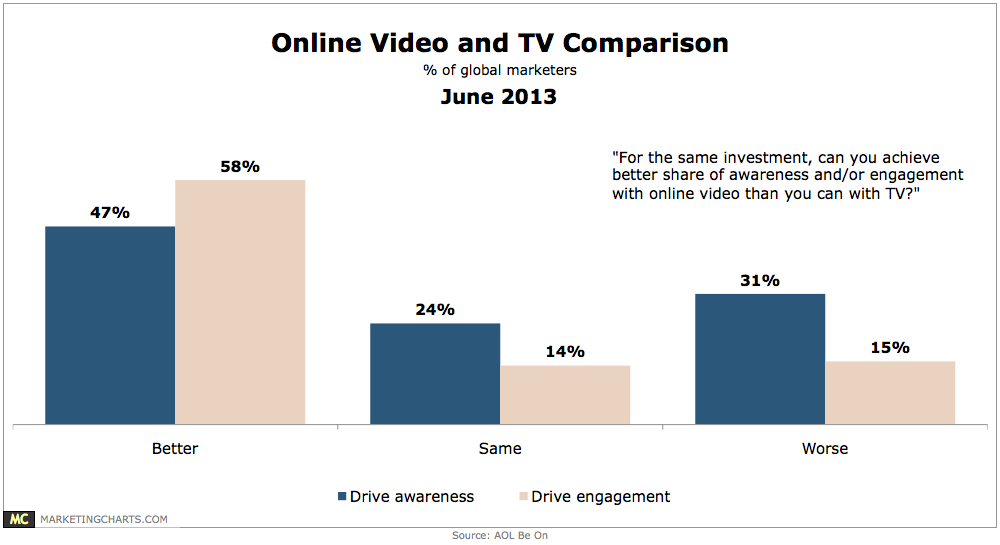
Among leading brands, media and creative agencies in the UK, Europe and North America, 58% believe that for the same investment they can achieve better share of engagement with online video than with TV.
Read More
Mobile & Tablet Video Ad Views By OS, Q1 2013 [CHART]
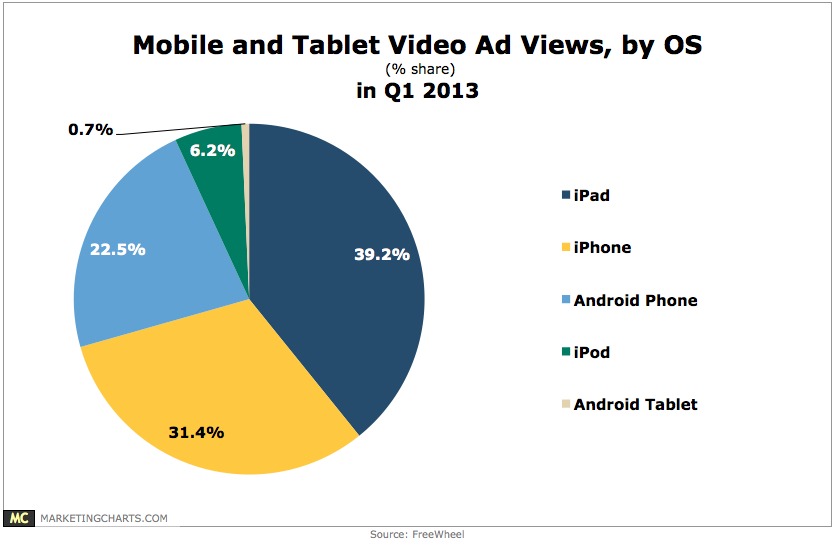
More mobile video ad views took place on an iPhone (31.4% share of mobile and tablet ad views) than an Android phone (22.5% share) in Q1.
Read MoreOnline Video Ads Views, December 2011 – April 2013 [CHART]
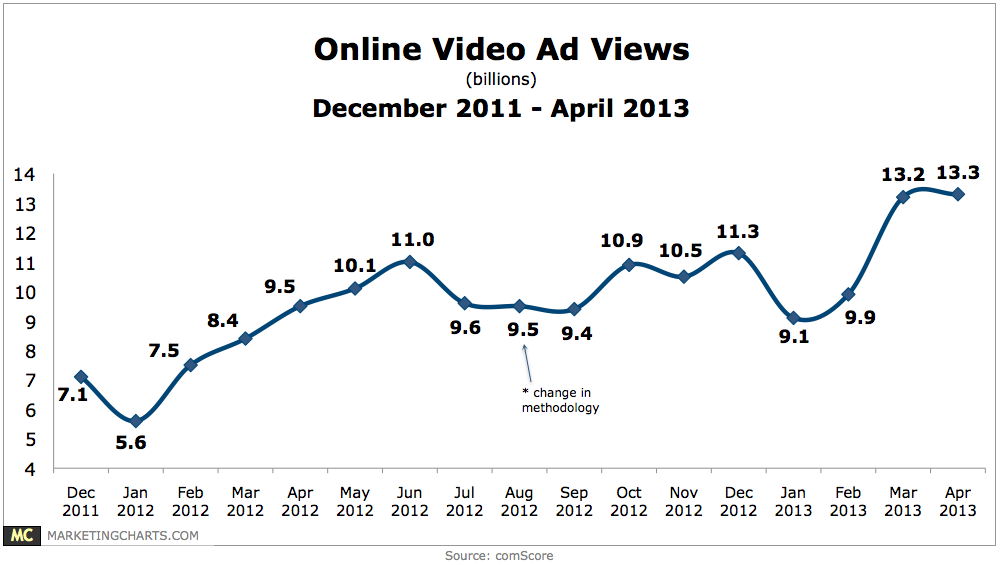
Online video ads bested their March record of 13.2 billion views by about 70 million or so views in April.
Read MoreChanges In Digital Marketing Spending By Category, March 2013 [CHART]
Marketers seem to have no hesitations about social, as 55% of respondents said they were putting more dollars to the format, while no advertisers reported decreasing social investments.
Read MoreAd Engagement Effectiveness On Made-for-Web Video Content vs Repurposed TV, May 2013 [CHART]

Click-through rates for the repurposed TV content (1.11%) and for the made-for-web content (1.09%) were evenly matched.
Read More