Video Advertising
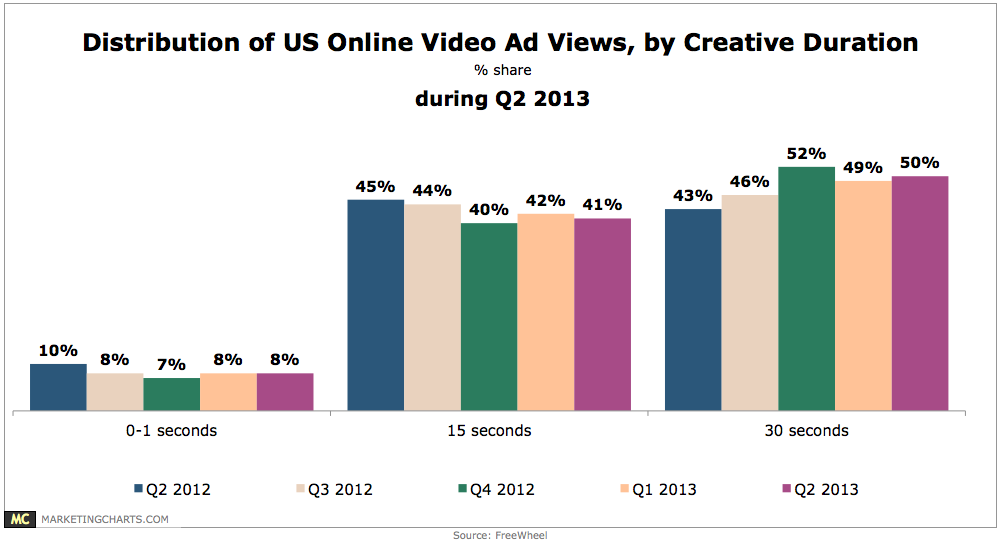
Online Video Ad Views By Duration, Q2 2013 [CHART]
The proportion of ad views represented by 30-second spots has slowly increased from 43% in Q2 2012, as 15-second spots gradually recede.
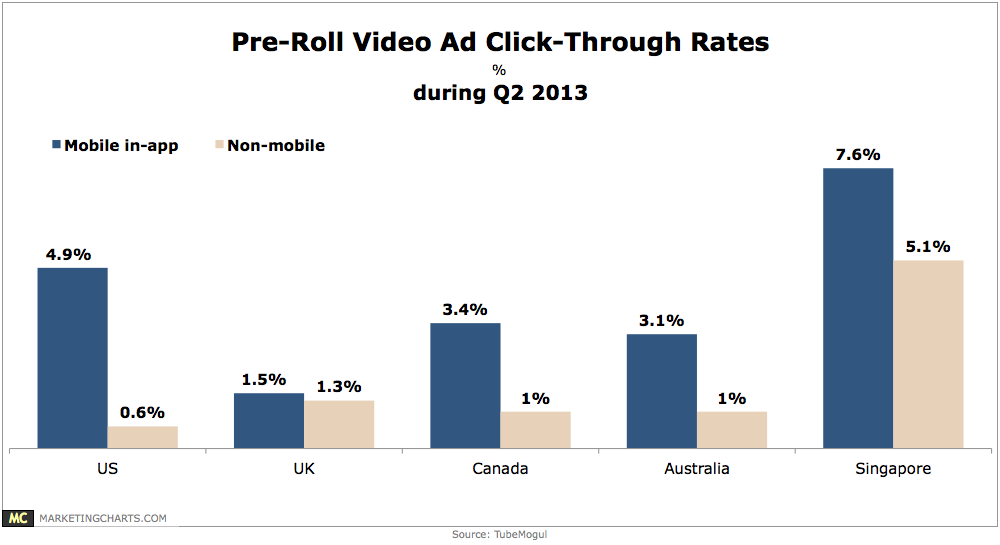
Read MorePre-Roll Video Ad Click-Through Rates, Q2 2013 [CHART]
Slightly more than half of mobile in-application pre-roll ads were completed in the US during Q2.
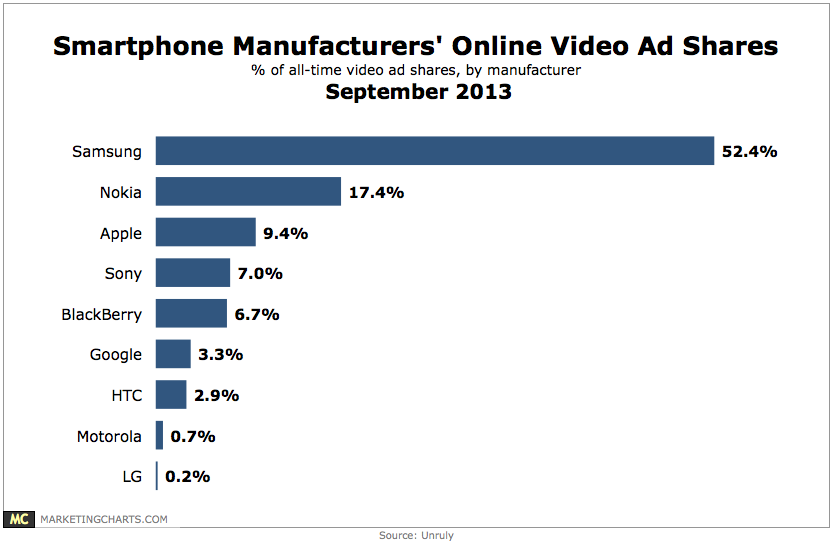
Read MoreSmart Phone Online Video Ad Shares By Manufacturer, September 2013 [CHART]
Apple may be the top smartphone manufacturer in the US, but it’s far behind Samsung when it comes to sharing of its video ads.
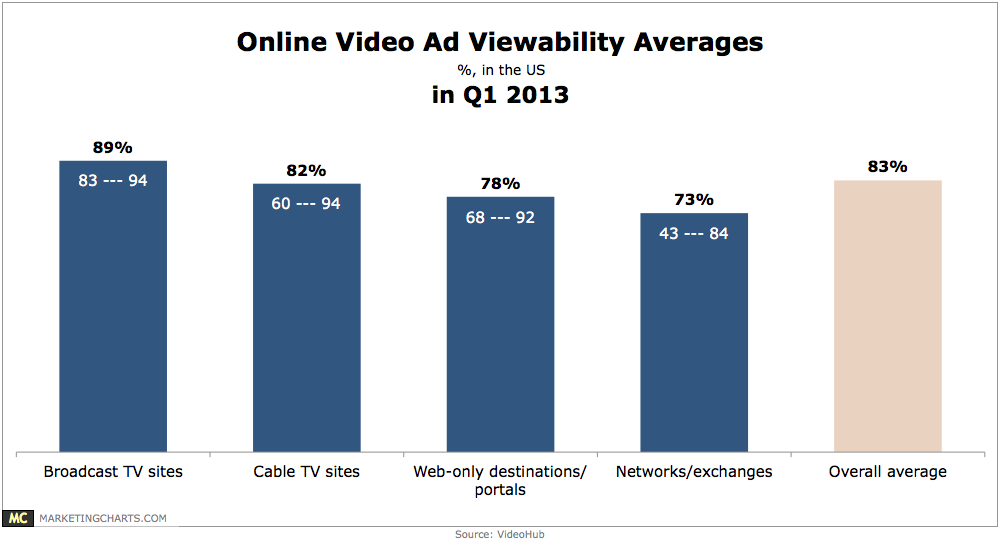
Read MoreOnline Video Ad Viewability Averages By Source, Q1 2013 [CHART]
During the first quarter, average viewability for online video ads in the US was 83%, although rates varied widely among properties.
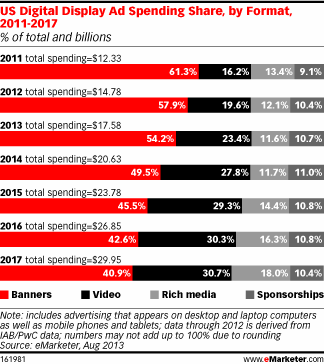
Read MoreUS Online Display Ad Spending Share By Format, 2011-2017 [CHART]
eMarketer estimates that video’s share of the overall digital display budget will rise from 23.4% this year to 30.7% by 2017.
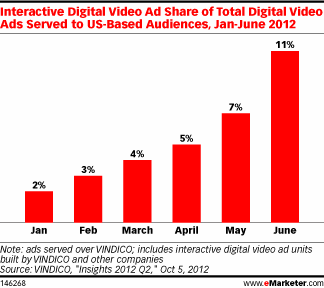
Read MoreInteractive Video Ad Share, January – June 2012 [CHART]
As of June 2012, data from video ad management company VINDICO showed that 11% of all digital video ads had some kind of interactivity.
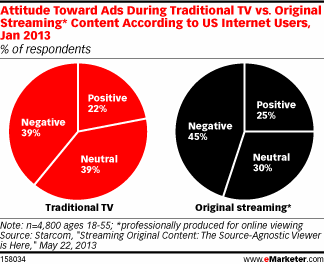
Read MoreAttitude Toward Ads During Traditional TV vs. Ads During Streaming Online Video, January 2013 [CHART]
US internet users had similar attitudes toward ads during traditional TV and original streaming content.
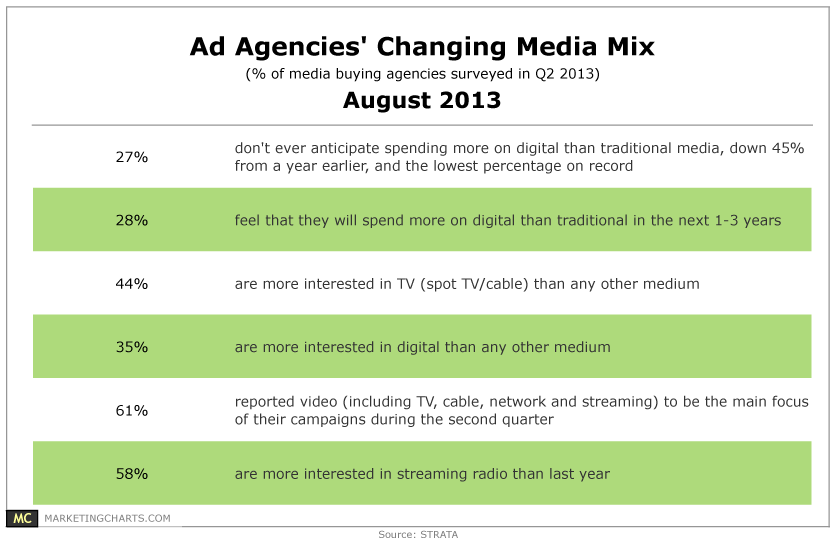
Read MoreAd Agencies' Changing Media Mix, August 2013 [TABLE]
Just 27% of media buying agencies don’t anticipate ever spending more on digital than traditional media.
Read MoreReach & Frequency Of Online Video Ads, January – July 2013 [CHART]
Online video ad reach took a step forward in July, increasing to 55.4% of the US population from 53.6% in June.
Read MoreOnline Video Ad Views, December 2011 – July 2013 [CHART]
Online video ad views have been increasing at a torrid pace through the first half of this year.
Read More