Video Advertising
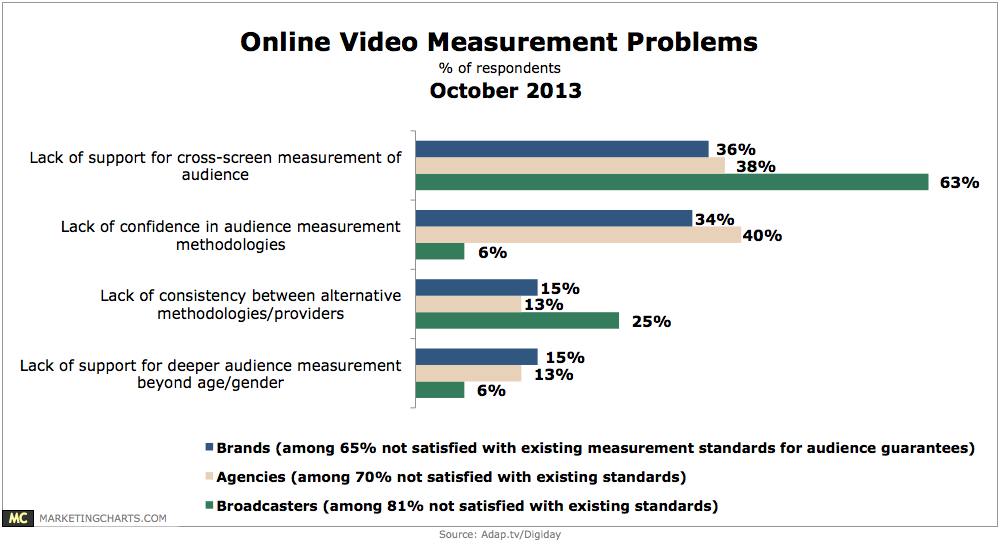
Online Video Measurement Problems, October 2013 [CHART]
65% of brands and 70% of agencies say that existing measurement standards for online video don’t satisfy their need for audience guarantees.
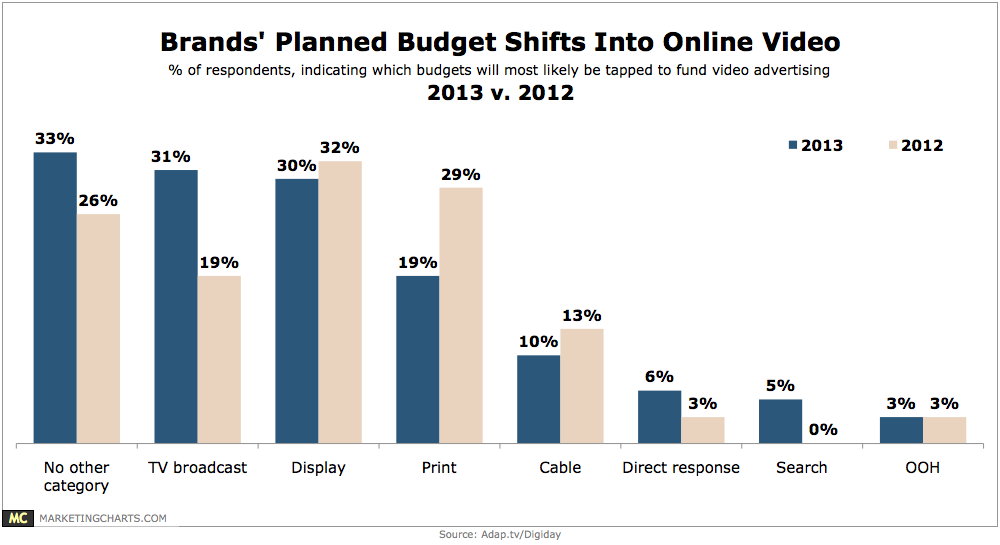
Read MoreBrands Planned Budget Shifts Into Online Video, 2012 vs 2013 [CHART]
Brands reported an average 65% increase in video ad spending this year over last, with agencies upping their expenditures by 83%.
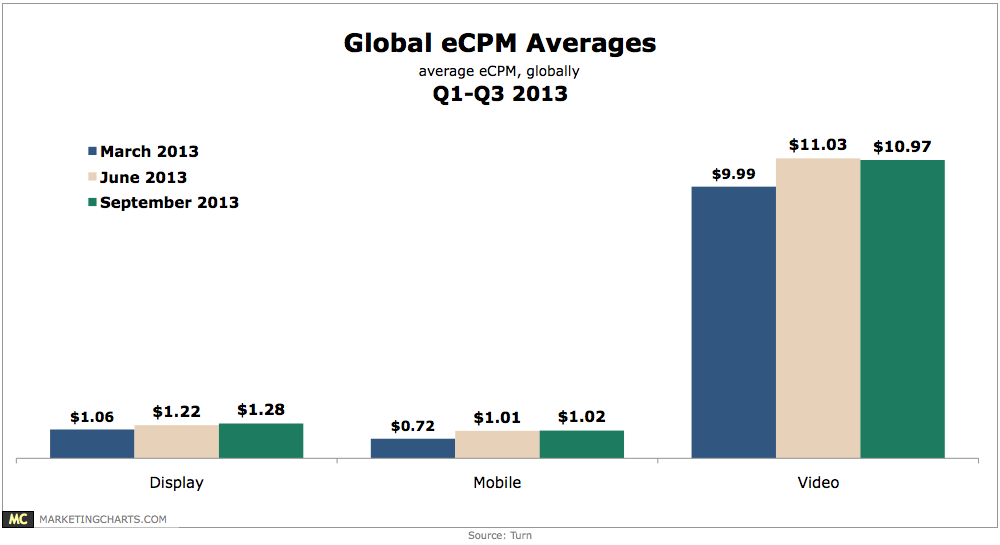
Read MoreGlobal eCPM Averages, Q1-Q3 2013 [CHART]
Global eCPM averages remained fairly steady on a quarter-over-quarter basis across display, mobile, and video channels, particularly when compared to trends from prior quarters.
Read MoreOnline Video Ad Performance By Age, Q3 2013 [CHART]
Slightly fewer than 1 in 8 online video ads in the US were targeted towards the 65+ crowd during Q3.
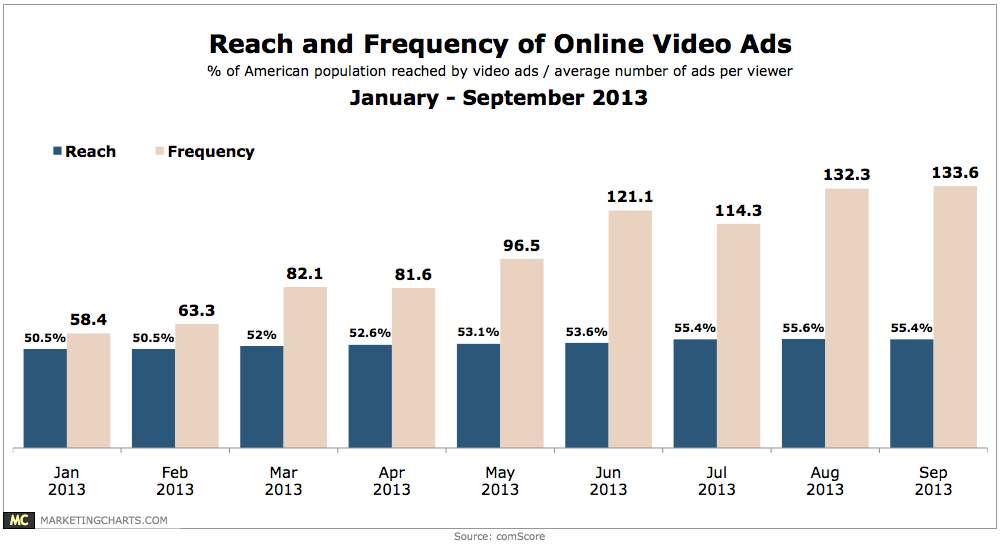
Read MoreReach & Frequency Of Video Ads, January – September, 2013 [CHART]
Video ads accounted for one-third of all videos viewed and 3.5% of all minutes that were spent watching online videos.
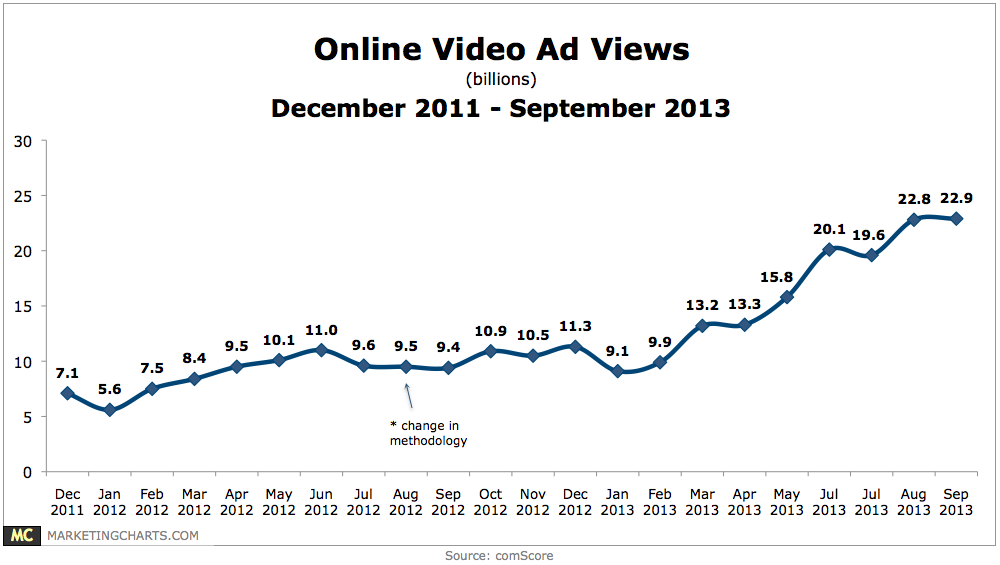
Read MoreOnline Video Ad Views, December 2011 – September 2013 [CHART]
Online video ad views continued to mount in September, though at a slower rate than seen earlier this year, according to the latest figures from comScore.
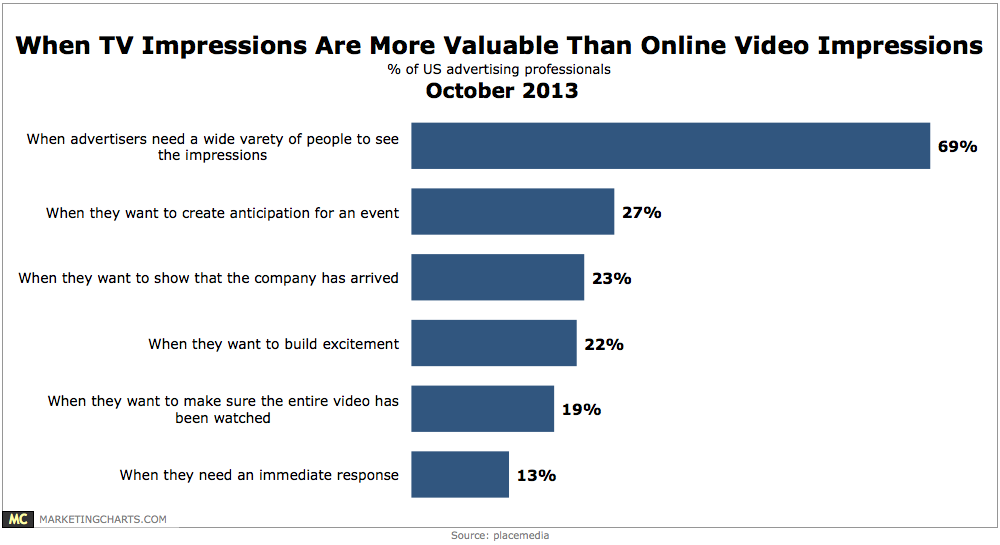
Read MoreValue Of TV vs Online Video Impressions, October 2013 [CHART]
89% of advertising professional responding to the survey find that TV impressions are more important than online video impressions.
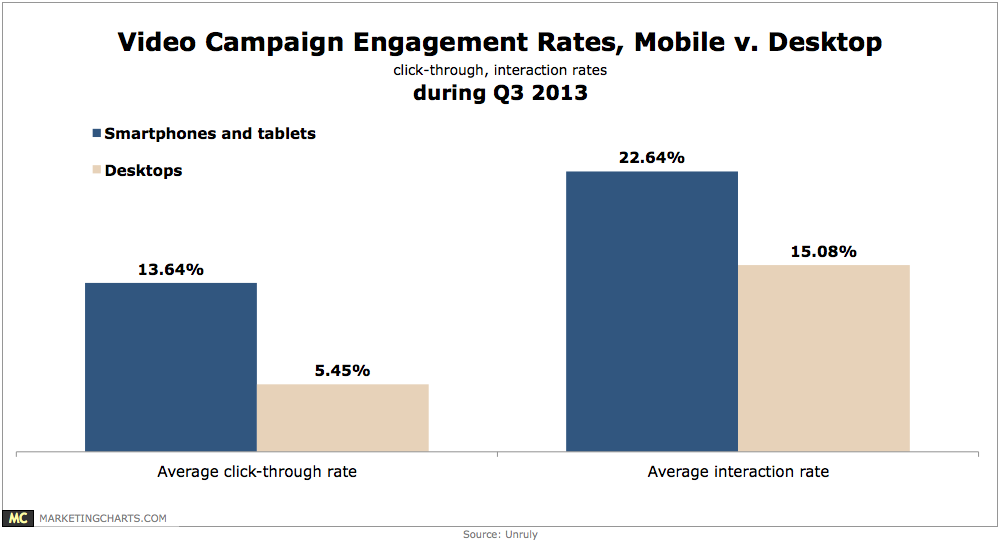
Read MoreMobile vs. Desktop Video Engagement Rates, Q3 2013 [CHART]
The average click-through rate (CTR) for video campaigns in Q3 was almost three times higher on smart phones and tablets (13.64%) than on desktops (5.45%).
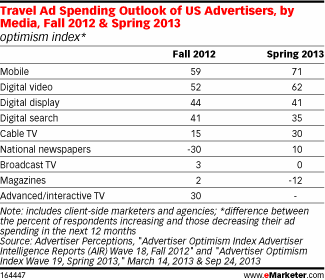
Read MoreTravel Ad Spending Outlook By Media, Fall 2012 & Spring 2013 [TABLE]
Travel in-stream video ads led all industries in 2012 with a 1.47% click-through rate.
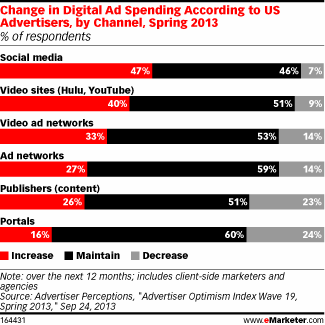
Read MoreChanges In Online Ad Spending By Channel, Spring 2013 [CHART]
Video sites such as Hulu and YouTube will see a significant share (40%) of advertisers increasing spending.
Read More