Video Advertising
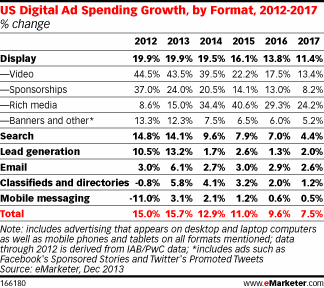
US Online Ad Spending Growth By Format, 2012-2017 [TABLE]
Programmatic buying, native advertising and viewability all remain topical to digital display advertisers, particularly brands.
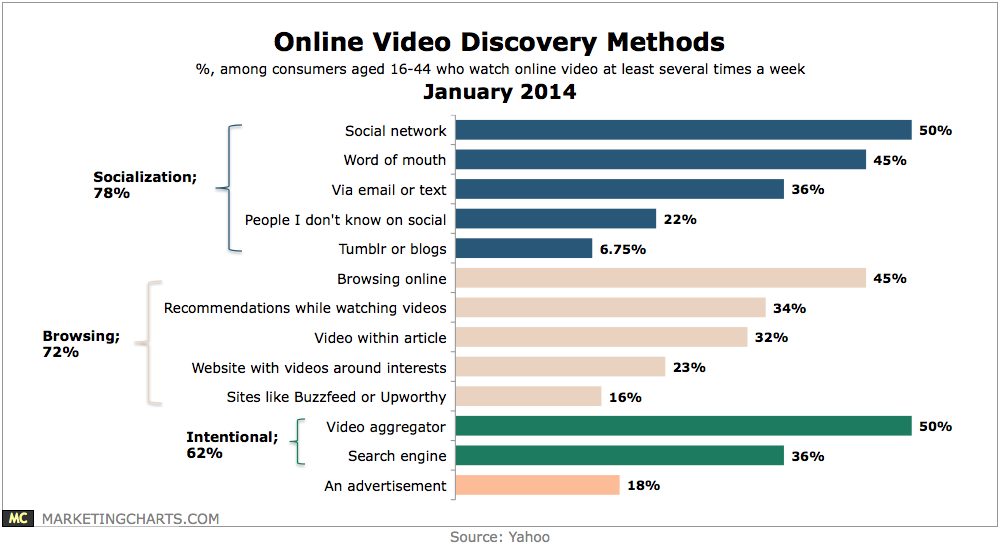
Read MoreOnline Video Discovery Methods, January 2014 [CHART]
Almost 8 in 10 find videos through social means, with 50% finding them through their social network and 45% from word-of-mouth.
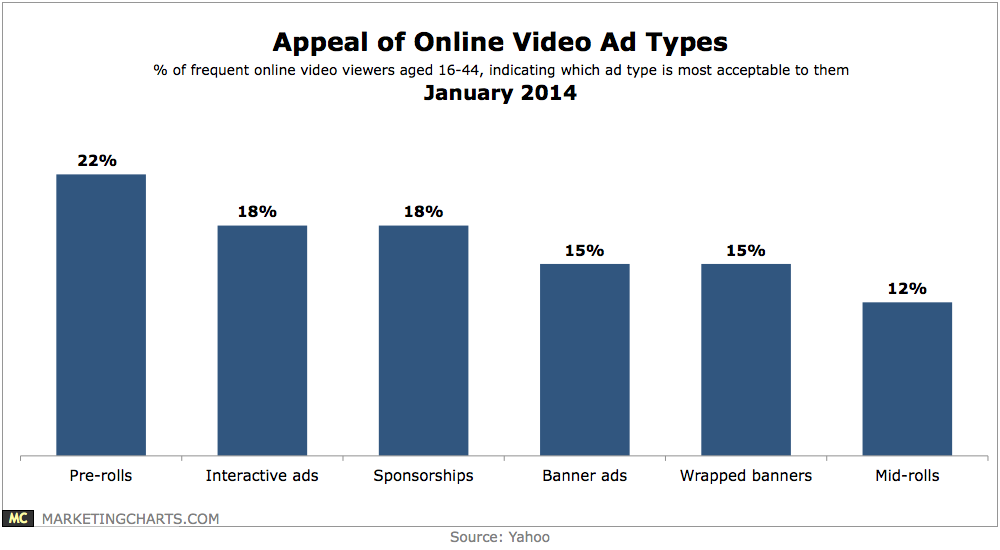
Read MoreAppeal Of Online Video Ad Types, January 2014 [CHART]
Across 6 ad types listed, pre-rolls emerged as the most acceptable type of ad, cited by 22% of respondents.
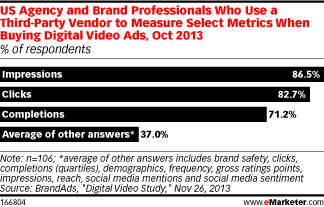
Read MoreVideo Ad Metrics, October 2013 [CHART]
The three metrics most used among agency and brand professionals when buying digital video ads were impressions, clicks and completions.
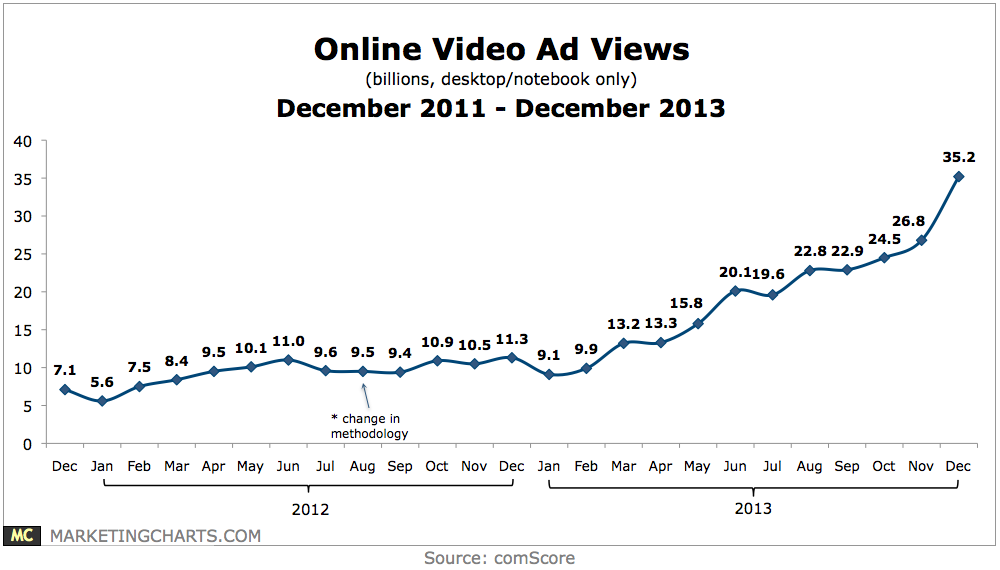
Read MoreOnline Video Ad Views, December 2011 – December 2013 [CHART]
Americans watched almost 52.4 billion online videos from desktops and notebooks in December 2013, surpassing the 50 billion mark for the first time on record.
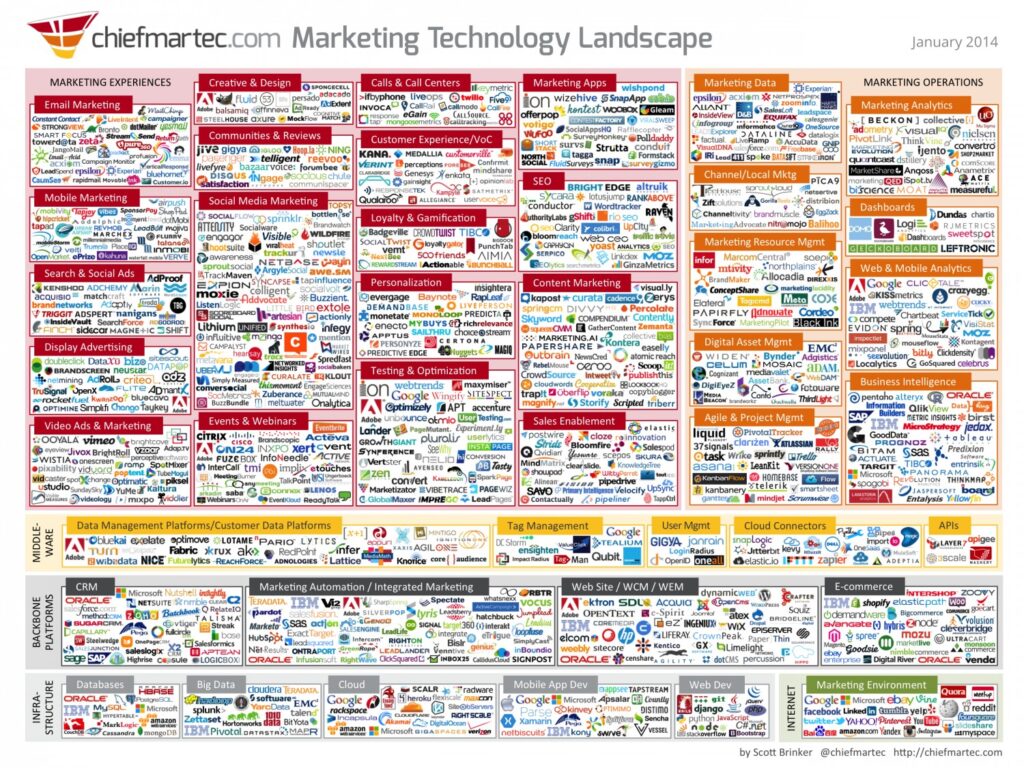
Read More2014 Marketing Technology Landscape [INFOGRAPHIC]
This infographic illustrates the marketing technology universe with 947 different companies that provide software for marketers.
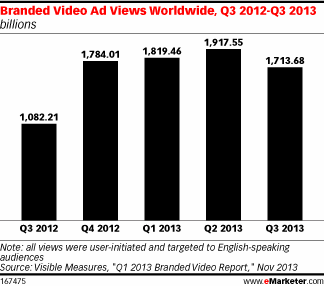
Read MoreGlobal Branded Video Views, Q3 2012-Q3 2013 [CHART]
Branded videos skyrocketed in viewership worldwide between the end of 2012 and 2013.
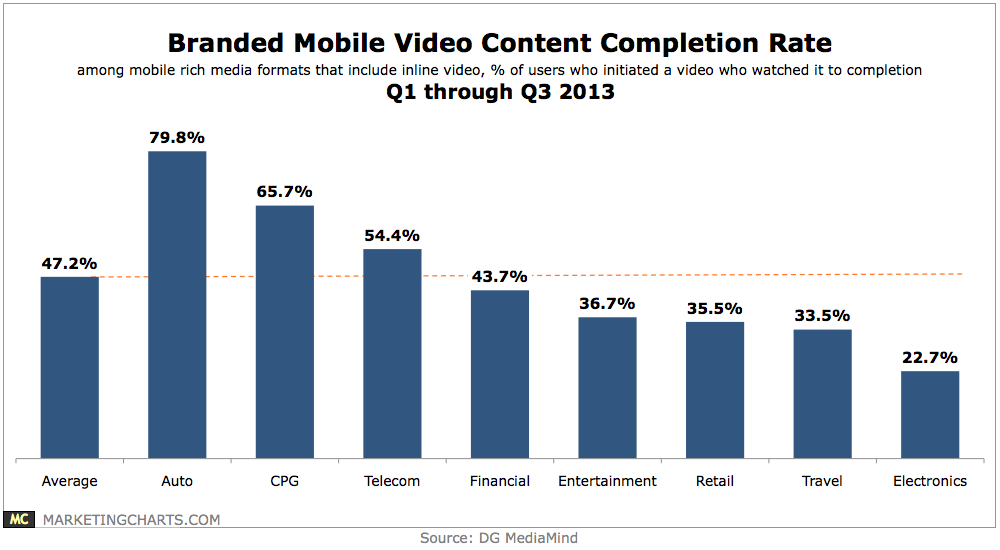
Read MoreBranded Mobile Video Content Completion Rates, Q1 – Q3 2013 [CHART]
47.2% of branded videos initiated by users were watched to completion, with that figure highest for auto (79.8%), CPG (65.7%) and telecom (54.4%) advertisers.
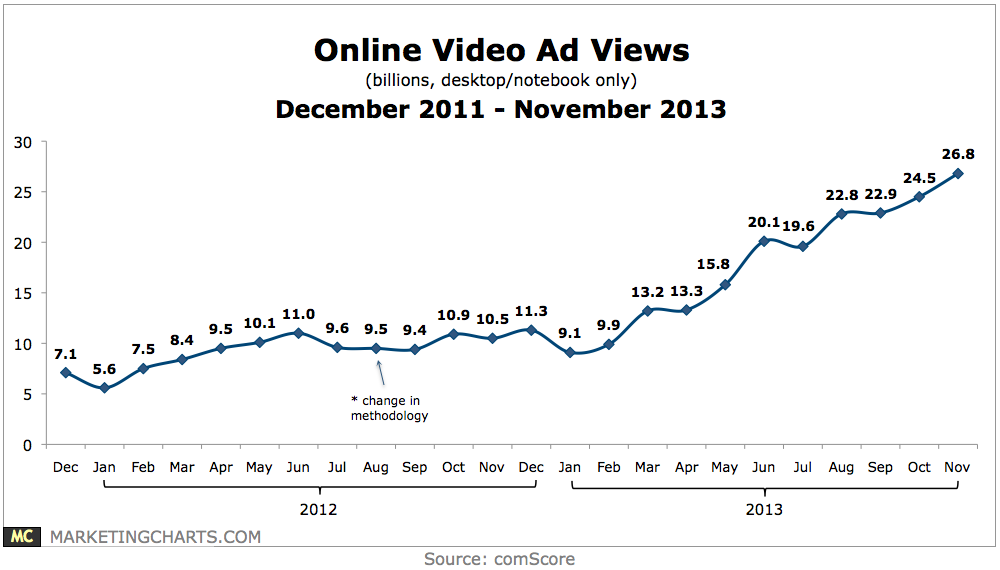
Read MoreOnline Video Ad Views, December 2011-November 2013 [CHART]
The number of online video ads Americans are watching from desktops and notebooks continues to rise on a monthly basis.
Read MoreTop Ads On YouTube For 2013 [CHART]
Which brands managed to take the most advantage of the burgeoning online video advertising space this year?
Read More