Video Advertising
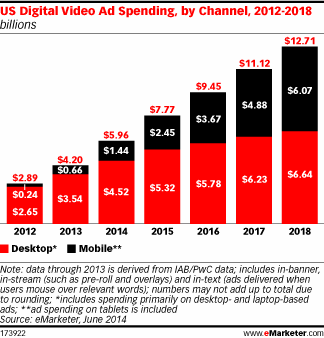
US Online Video Ad Spending By Device, 2012-2018 [CHART]
Online video remains well ahead of ad investments in video programming on smartphones and tablets—for the time being.
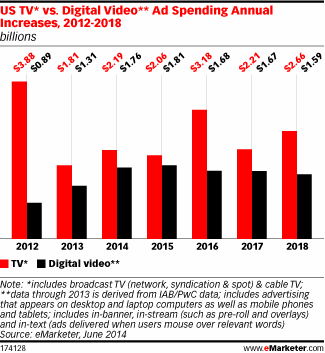
Read MoreUS TV vs. Online Ad Spending Increases, 2012-2018 [CHART]
Despite digital video’s astronomical rise percentagewise, eMarketer projects that TV will add more new dollars this year.
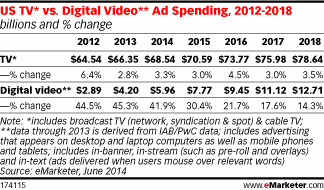
Read MoreUS TV vs. Online Video Ad Spending, 2012-2018 [TABLE]
Digital video advertising in the US is increasing at an eye-popping rate, but TV ad spending will still outpace digital video in dollar growth in 2014.
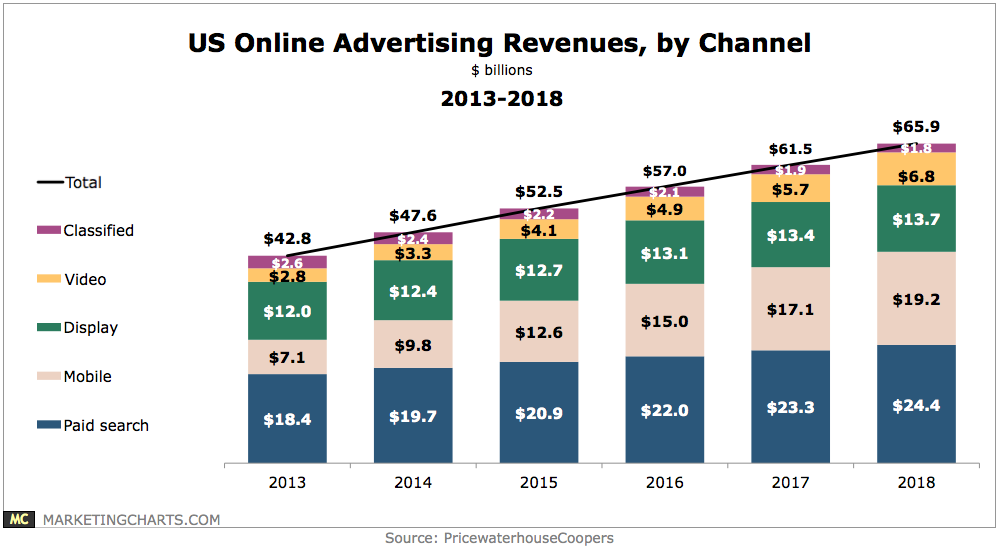
Read MoreUS Online Ad Revenues By Channel, 2013-2018 [CHART]
Mobile ad spending is growing at such a rate that it will soon overtake display advertising to become the second-largest digital advertising channel in the US.
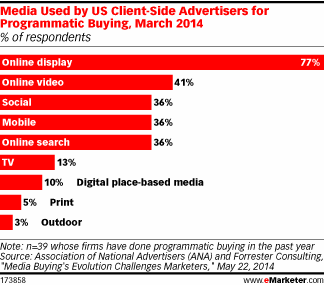
Read MoreTypes Of Programmatic Buying Used By Client-Side Advertisers, March 2014 [CHART]
More than half of marketers studied didn’t understand programmatic well enough to buy and execute campaigns with it.
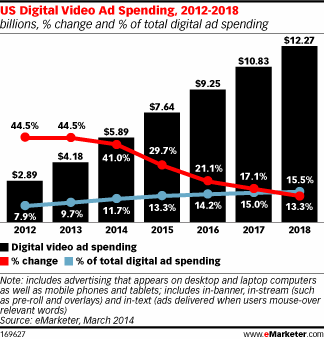
Read MoreUS Online Video Ad Spending, 2012-2018 [CHART]
Online video advertising will make up nearly 12% of all digital ad spending in the US this year.
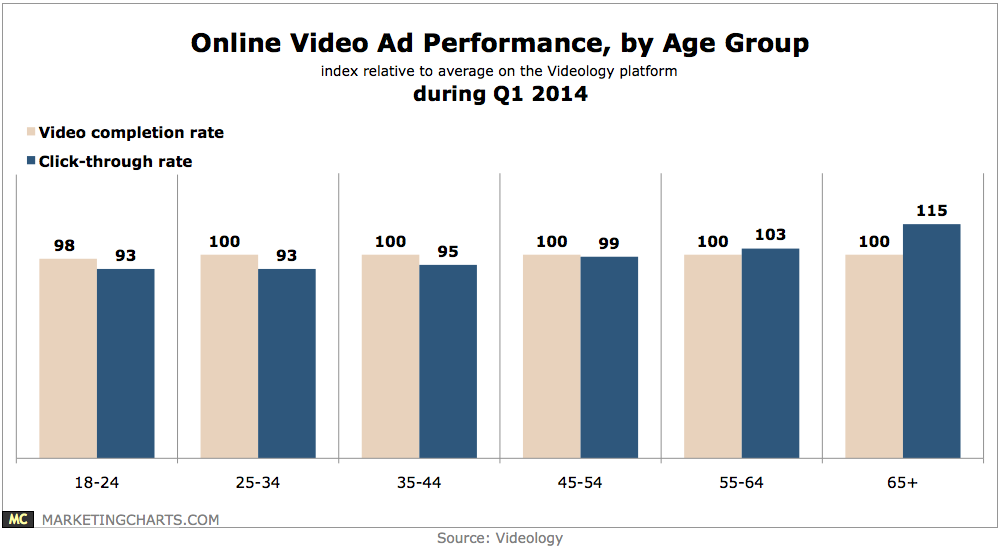
Read MoreOnline Video Ad Performance By Age, Q1 2014 [CHART]
Older viewers were more likely to click on video ads than their younger counterparts in Q1.
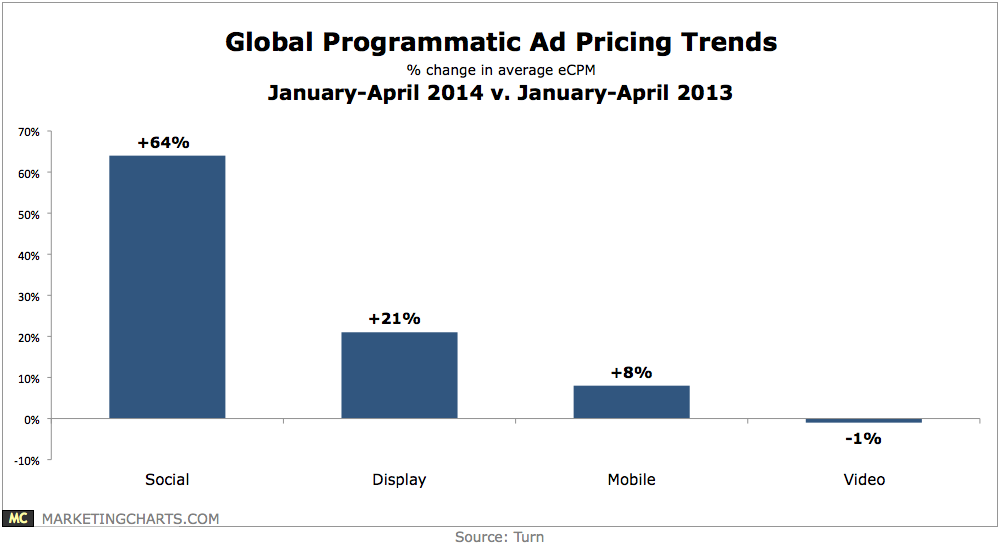
Read MoreGlobal Programmatic Ad Pricing Trends, 2013 vs 2014 [CHART]
Social and display advertising have become more competitive and seen a 64% and 21% year-over-year increase, respectively, in average eCPM from January through April 2014.
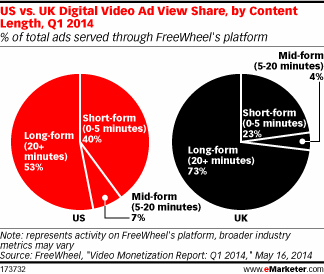
Read MoreUS vs UK Video Ad View Share By Length, Q1 2014 [CHART]
25% of internet users in Great Britain typically watched TV via video-on-demand services, a proportion well above the other countries polled.
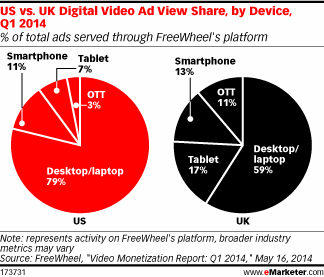
Read MoreUS vs UK Video Ad View Share By Device, Q1 2014 [CHART]
Tablets accounted for 17% of total digital video ad views (of ads served through the company’s network) in the UK in Q1 2014.
Read More