User Experience
Quantified Self Universe [VENN DIAGRAM]
As quantified self becomes more established in the market, its intersection with mobility, social networking, and ethnography is one of the most intriguing areas of coverage.
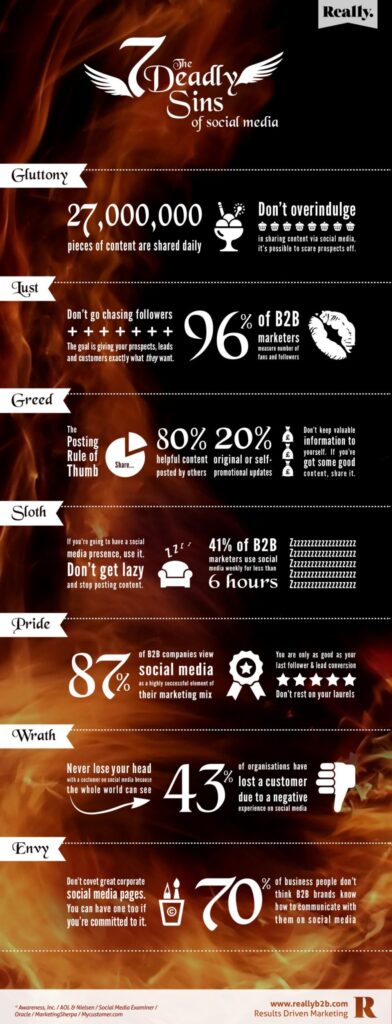
Read MoreThe 7 Social Media Sins [INFOGRAPHIC]
This infographic by Really illustrates the seven deadly sins of social media.
Read More10 Hot Job That Didn’t Exist 5 Years Ago [INFOGRAPHIC]
This infographic from LinkedIn highlights the 10 most popular job titles that were nowhere to be found in 2008.
Read MorePsychology Of The eCommerce Checkout [INFOGRAPHIC]
This infographic from VoucherCloud illustrates how various factors influence the eCommerce checkout process.
Read MoreImportance Of Responsive Design [INFOGRAPHIC]
This infographic by SEOcial illustrates 10 key statistics that highlight the importance of responsive design.
Read MoreGrowth Of mCommerce [INFOGRAPHIC]
This infographic by Judo illustrates the growth of mCommerce.
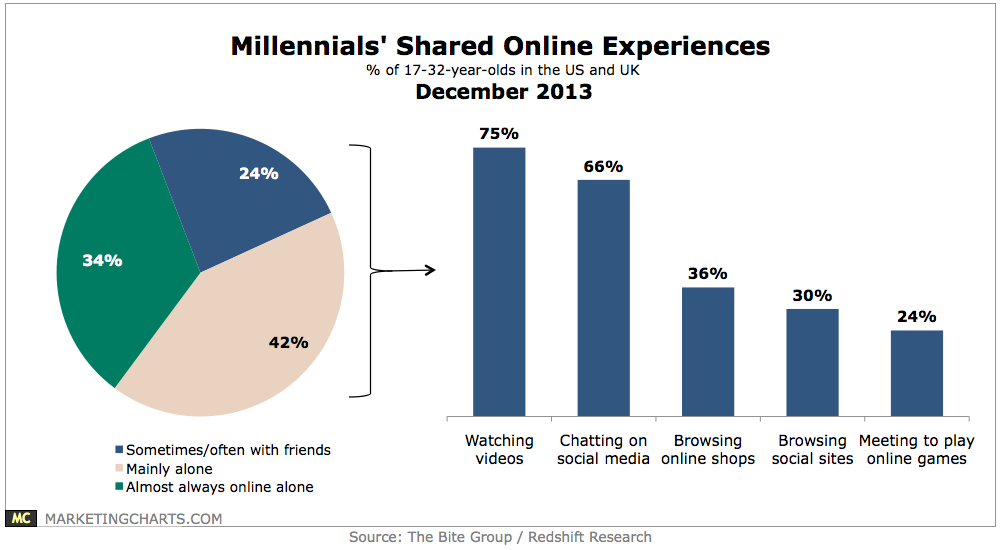
Read MoreMillennials' Shared Online Experiences, December 2013 [CHART]
Two-thirds of Millennials said they share at least some social experiences online.
Read MoreMobile Retail Site Performance, November 2013 [TABLE]
From an iPhone 4s, the median mobile site took 4.33 seconds to load, far quicker than the median full site page load time of 7.84, but still well below Google’s recommendation of 1 second or less.
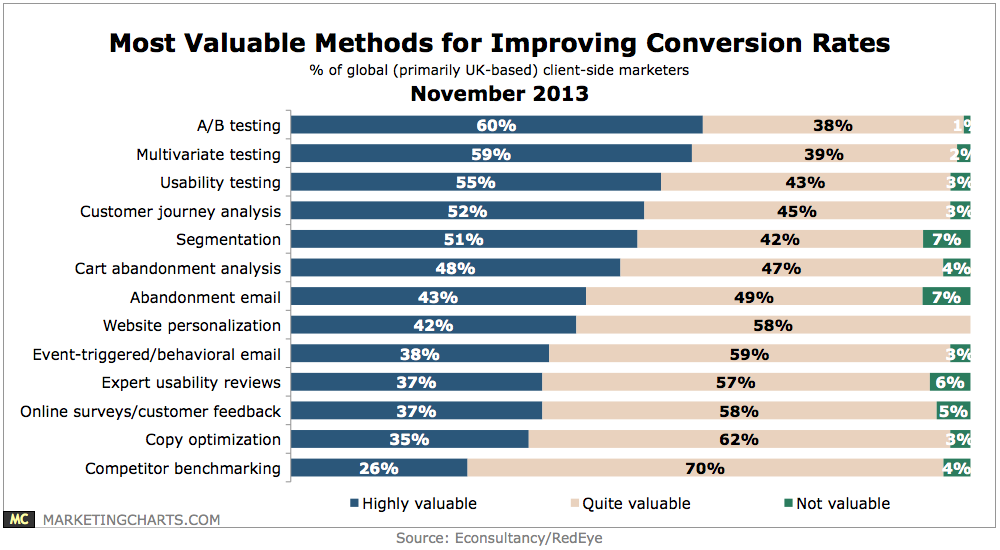
Read MoreTop Testing Tactics For Improving Conversions, November 2013 [CHART]
Marketers from around the world (but primarily from the UK) say that conversion rate optimization is crucially important to their online marketing strategies.
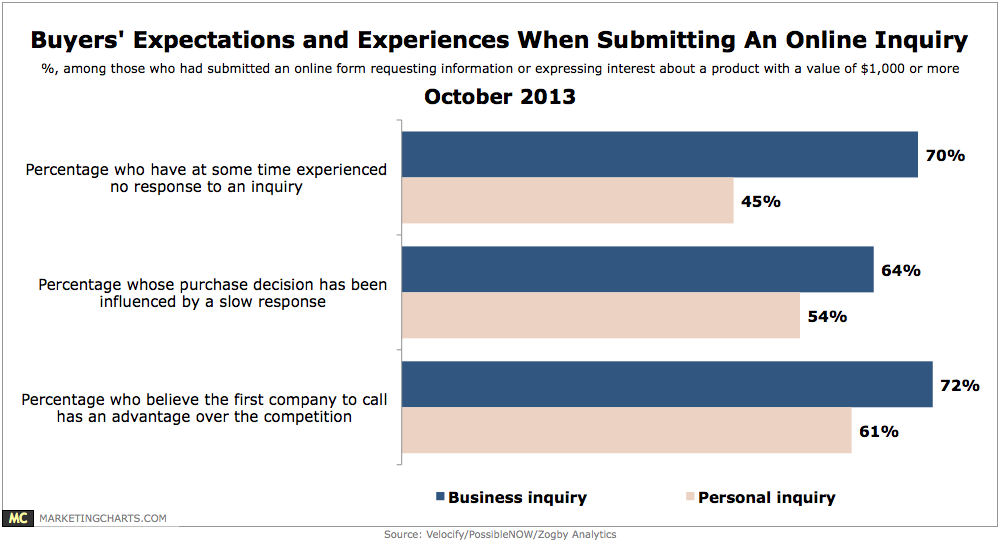
Read MoreBuyers' Expectations & Experiences When Inquiring Online, October 2013 [CHART]
When inquiring about a product or service, only 6% of all potential buyers submit online inquiries to a single company, with a significant majority submitting inquiries to 3 or more companies.
Read More


