Television Advertising
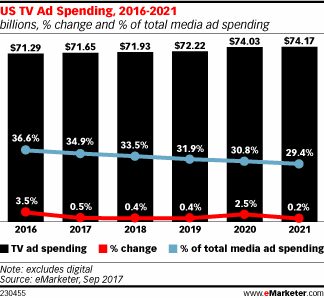
Television Advertising Spending, 2016-2021 [CHART]
eMarketer has reduced its estimate for US TV ad spending due to faster-than-expected growth in cord-cutting.
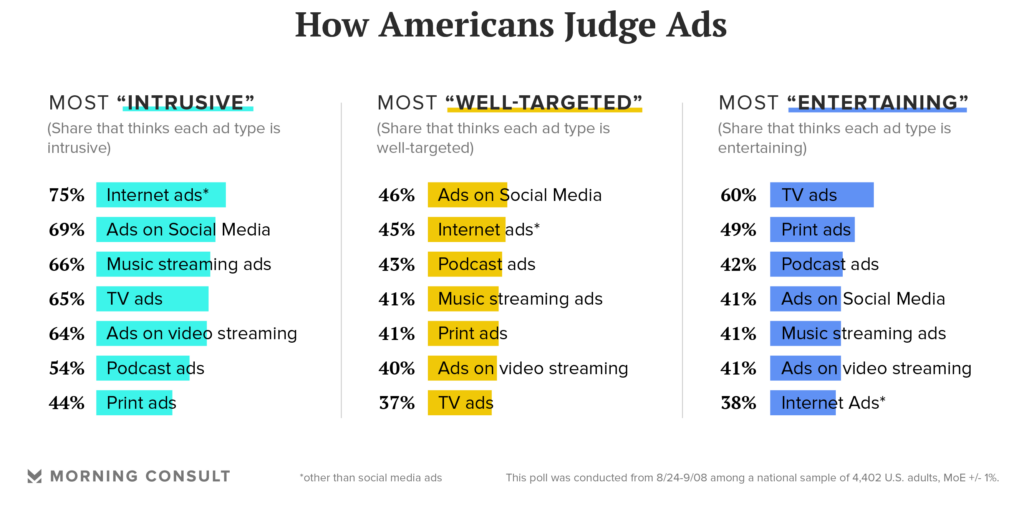
Read MoreHow Americans Judge Advertisements [CHART]
63 percent of adults in the United States report seeing more advertisements than they used to, compared to the 24 percent who said they were seeing the same amount.
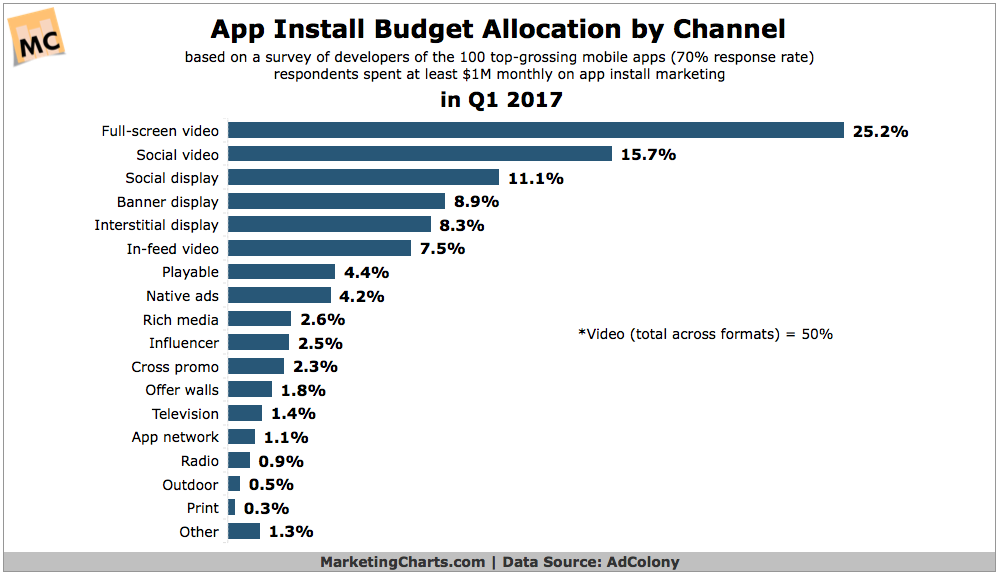
Read MoreTop App Installation Marketing Methods [CHART]
Video formats now account for half of all app install spending by developers of the 100 top-grossing apps.
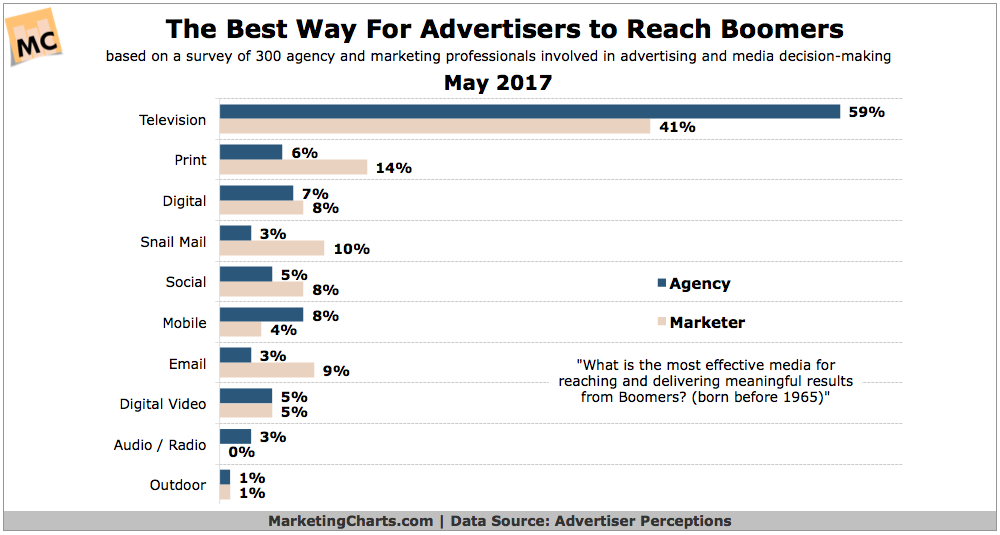
Read MoreBest Way To Reach Baby Boomers [CHART]
TV is, by a large margin, the best way to reach Boomers (born before 1965), according to marketers and agency professionals.
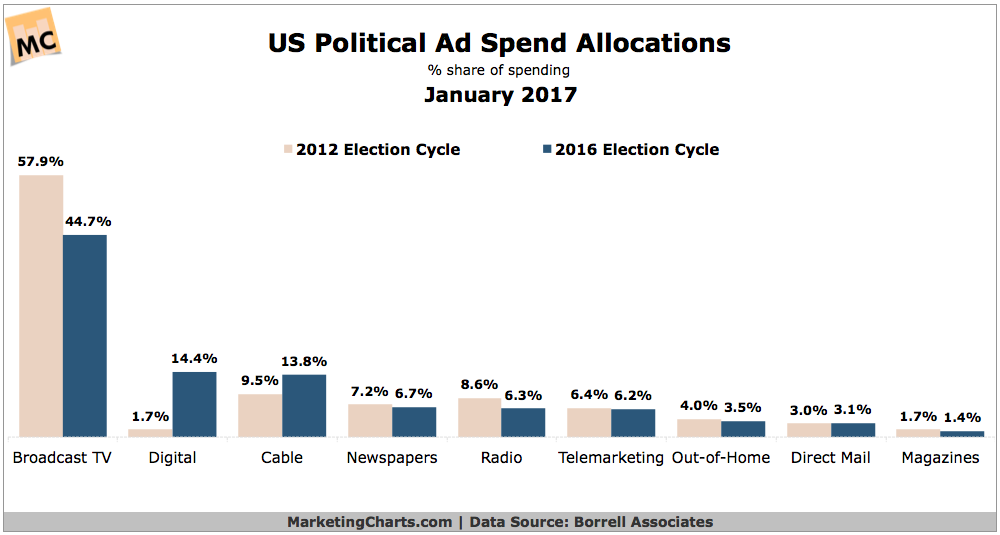
Read MoreUS Political Ad Spending Allocations, 2012 vs 2016 [CHART]
Political advertising reached $9.8 billion in the 2016 election year, marking a more than 4% increase from the 2012 election cycle ($9.4 billion) and representing a new record.
Read MoreOnline Reviews & Ratings [INFOGRAPHIC]
This infographic from Websitebuilder.org illustrates the facts and importance of online consumer reviews and ratings to a wide variety of businesses.
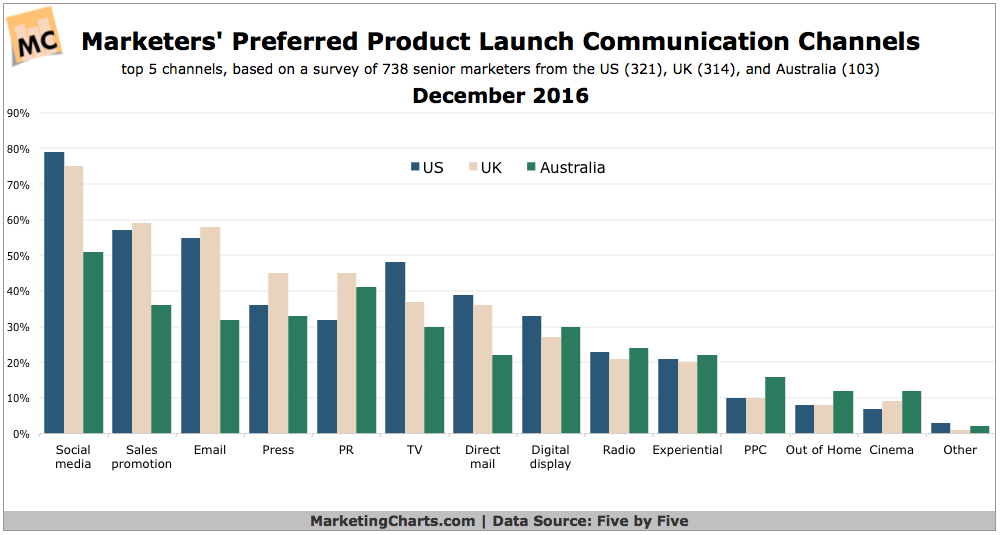
Read MoreTop Product Launch Communications Channels [CHART]
Senior marketers in the US, UK and Australia prioritize social media more than any other communications channels for product launches.
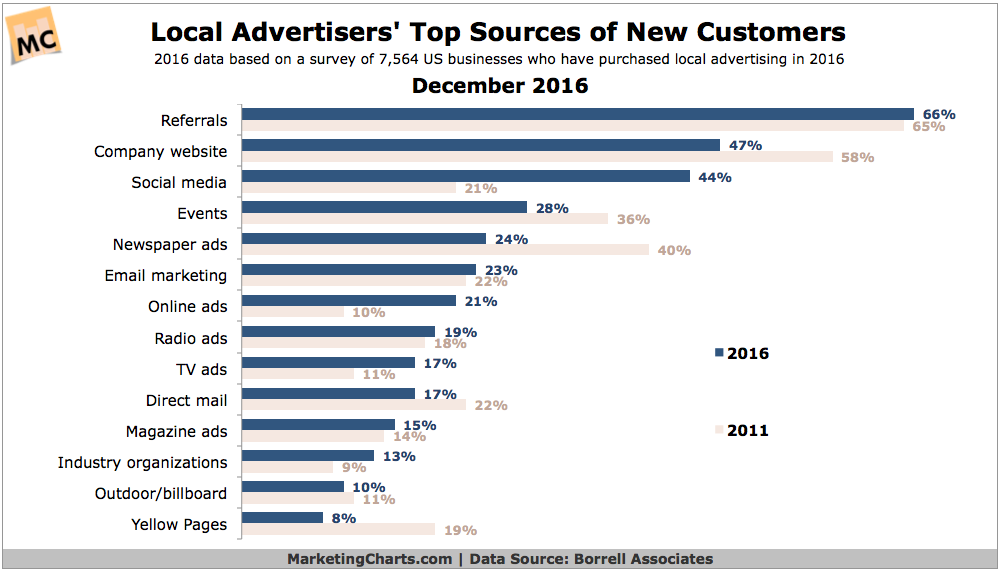
Read MoreTop Sources Of New Customers For Local Businesses [CHART]
Referrals (66%) and company websites (47%) continue to be the best sources of new customers for local advertisers, much as they were back in 2011.
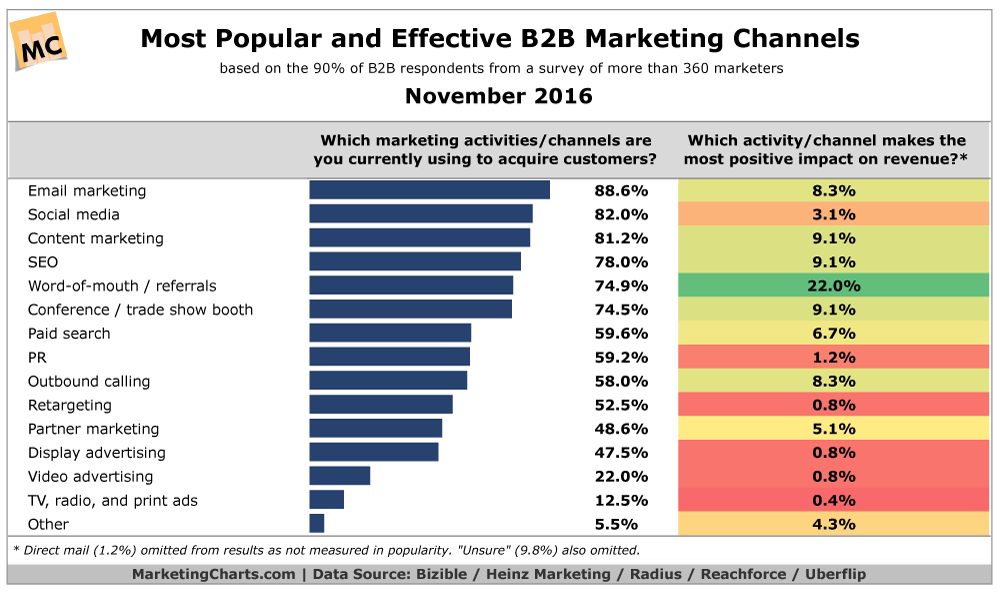
Read MoreTop B2B Marketing Channels [CHART]
Used by almost 9 in 10 respondents, email marketing is the most popular channel used by B2B marketers to acquire customers.
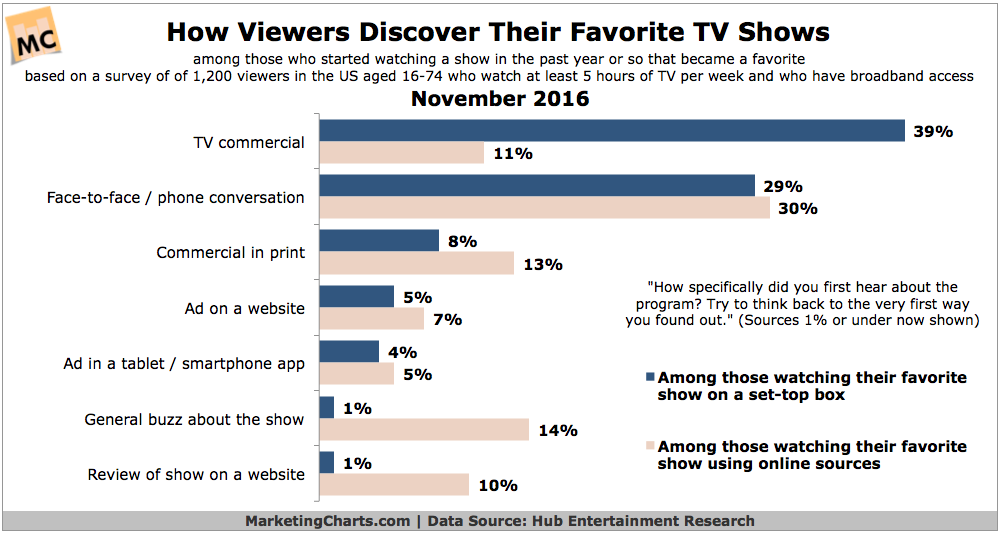
Read MoreHow People Find Their Favorite TV Shows
Live TV remains the single most common place to watch viewers’ new favorite shows, with 34% saying that’s their viewing source.
Read More