Television Advertising
Top 2012 TV Brand Advertisers By Category [TABLE]
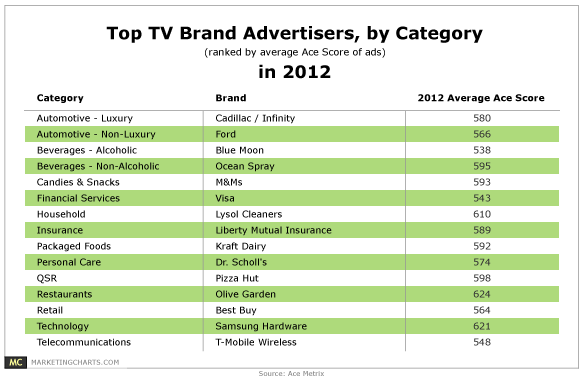
2012 television brand advertising was marked by creative strategies that stressed innovation while embracing cause and humor.
Read MoreUS Total Media Ad Spending Share By Channel, 2010-2016 [CHART]
Just 2.4% of total ad spending in the US will go toward mobile ads in 2012.
Read MoreConsumer Interest In Interactive TV, December 2012 [CHART]
35% of respondents indicated an interest in real-time games and challenges with shows via a second screen.
Read MoreB2B Lead Quantity & Quality By Channel, December 2012 [CHART]
4% rated leads generated from print, radio &TV ads as high quality, tied with display/CPM advertising at the bottom of the list of 14 identified channels.
Read MoreMarketing That Prompts Mobile Device Actions, October 2012 [CHART]
TV ads were the No. 2 reason consumers turned to their mobile devices for actions such as brand searches, app downloads or visiting brand sites.
Read MoreMobile Device Users Attitudes Toward Ads By Medium, November 2012 [CHART]

Smart phone and tablet owners may love their devices, but they’re not all that fond of advertising on them.
Read MoreTablet Product Searches Prompted By TV By Generation, November 2012 [CHART]
7 in 10 tablet owners say that when they see a product they’re interested in on TV, they use their tablet to get more information.
Read MoreBest Source For Marketing & Advertising, October 2012 [CHART]

US consumers and marketers alike cited newspapers and TV as the best source of marketing and advertising.
Read MoreB2B Marketing Strategies, 2011 & 2012 [CHART]
That was up 5 percentage points from usage levels in 2011, impressive considering the already-high level of interest in content marketing.
Read MoreTop 10 TV Programs By Cost Of 30-Second Spot, 2011-2013 Season [CHART]
NBC’s “Sunday Night Football” commands the highest average price for a 30-second spot.
Read More