Television Advertising
Social Super Bowl XLVII [INFOGRAPHIC]
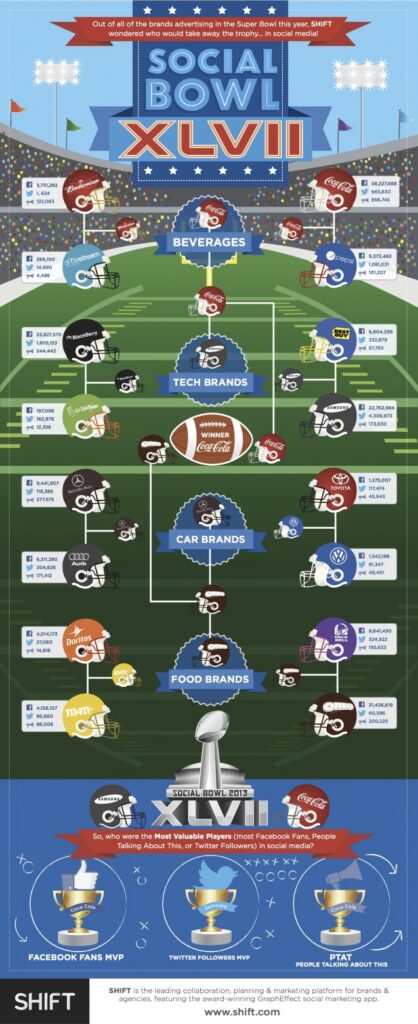
This infographic pits some major brands that advertised during Super Bowl XLVII against one another based on social media presence.
Read MoreHousehold Shopping Inspiration Sources, February 2013 [CHART]
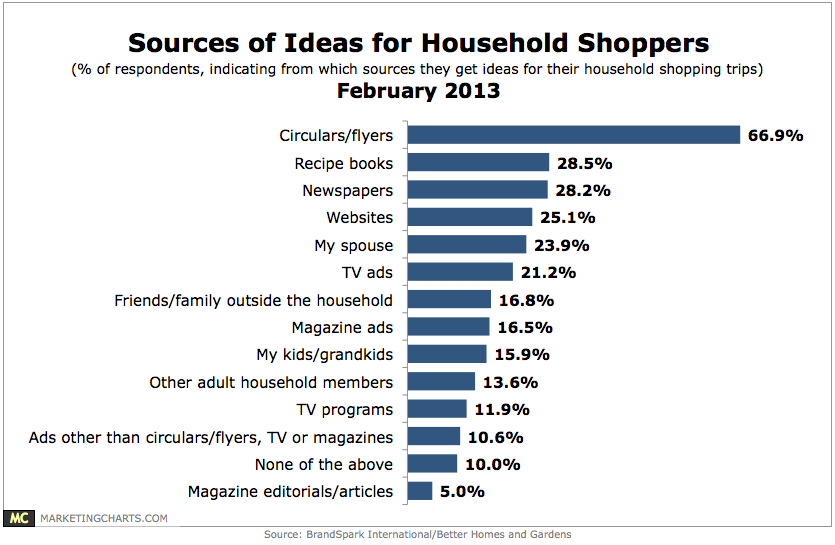
66.9% of American consumers say they get ideas for their shopping trips from circulars and flyers.
Read MoreAttitudes Toward Super Bowl Commercials By Gender, January 2013 [TABLE]
More than three-quarters of consumers viewed the commercials as entertainment, up from 73% last year—however, only 10.5% said they were actually influenced to buy as a result of the spots.
Read MoreAverage Cost Of Super Bowl Ads, 2008-2012 [CHART]
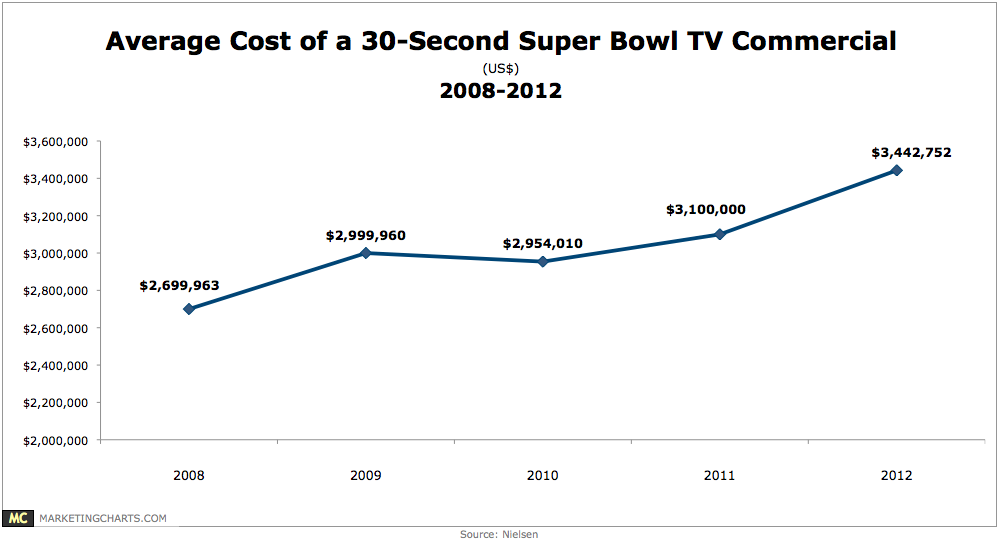
The upcoming Super Bowl, the biggest sporting event of the year, is obviously also a huge event for advertisers, who spent an average of $3.4 million per 30-second TV spot last year.
Read MoreChanges In SMBs' Ad Spending Tactics For 2013 [TABLE]
Of those SMBs who have used mobile advertising, a solid 83% said they were at least somewhat likely to use it again in 2013.
Read MoreConsumer Purchase Decision Information Sources, January 2013 [CHART]
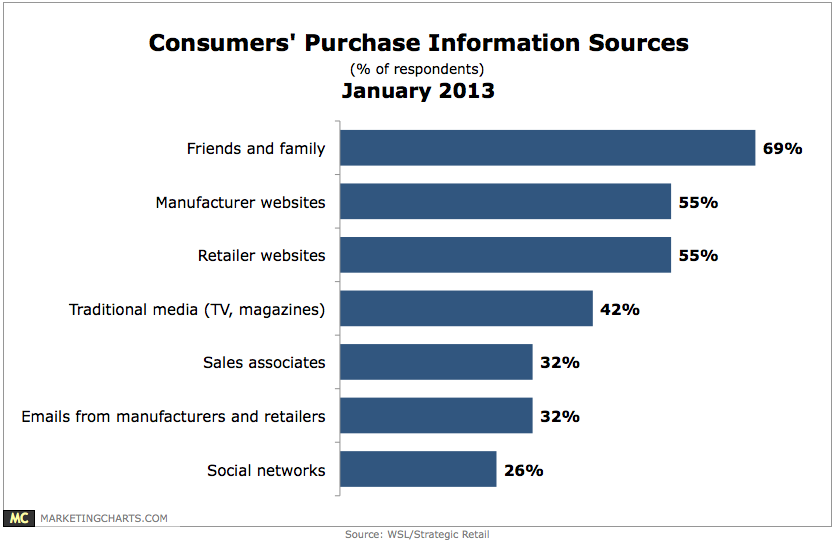
Consumers still look first to their friends and family for advice regarding their purchase decisions.
Read MoreSMB Local Advertising Spending By Medium, 2012 vs 2013 [CHART]
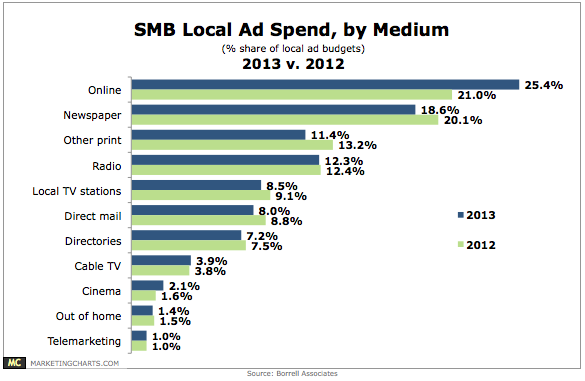
SMBs will devote 26.6% of their local ad budgets to newspapers (18.6%) and other print media (8%) this year.
Read MoreSMB Media Ad Buys, January 2013 [CHART]
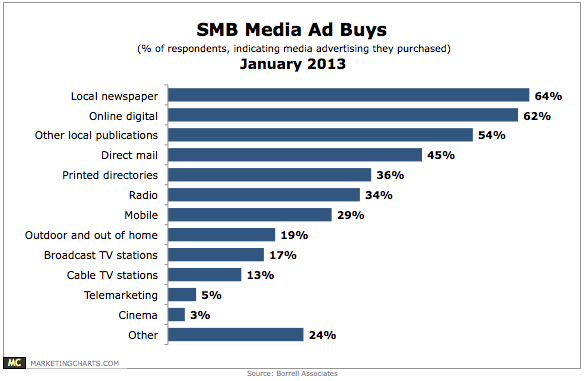
Newspaper ad expenditures have been on a steady decline for several quarters now, but SMBs still see the local paper as a valuable advertising medium.
Read MoreGlobal Ad Spending Growth By Medium, 2012 vs 2013 [CHART]
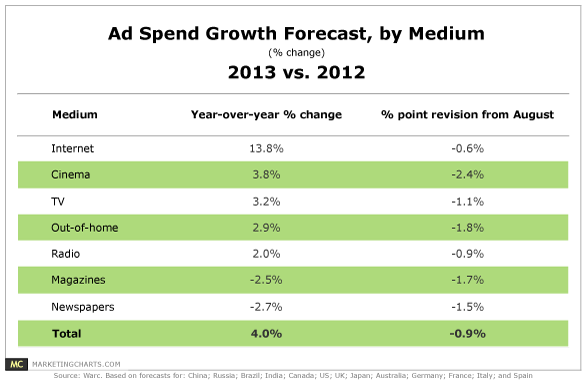
Global advertising spending will grow by 4% this year.
Read MoreOldSpice.com Traffic vs. Old Spice YouTube Traffic, July 2011-August 2012 [CHART]

Compete looked at how well Old Spice performed on its YouTube channel compared to its brand site during some popular ad campaigns.
Read More