Television Advertising
Global Ad Spending By Medium, 2012 vs 2015 [CHART]

By 2015, the internet should account for 23.4% of global ad spending, details Zenith Optimedia in a new forecast.
Read MoreLocal TV Ad Revenues, 2006-2017 [CHART]
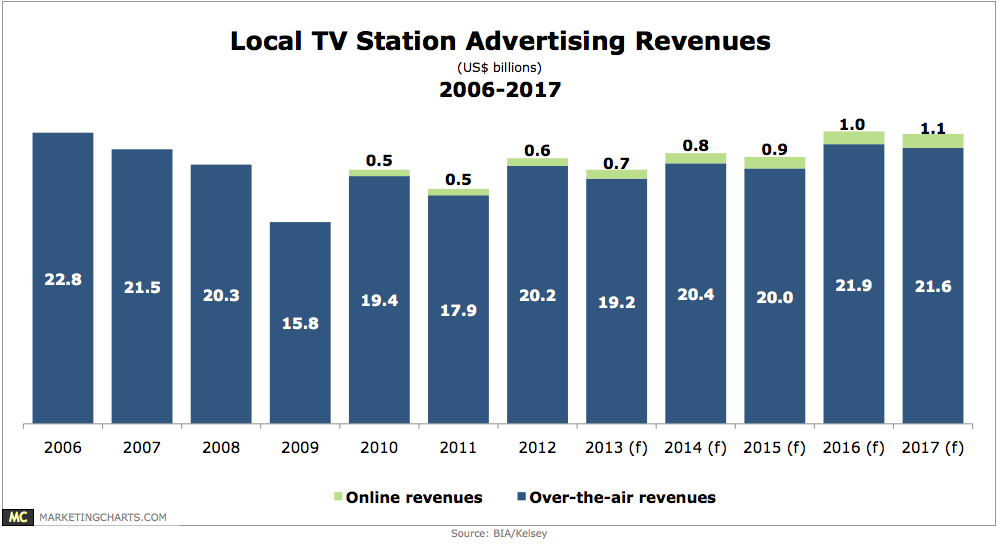
Political advertising fueled a 13% increase in local TV ad revenues last year, to $20.8 billion.
Read MoreTop Sources Of Annoying Ads, March 2013 [CHART]
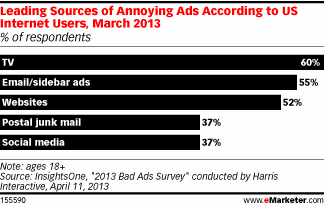
More than nine in 10 internet users reported encountering an annoying ad somewhere, according to the poll.
Read MoreGlobal Ad Spending Growth By Media, 2012 [CHART]

TV, which commands the lion’s share of global ad budgets, saw a 4.3% increase in expenditures for the year, reaching $350 billion.
Read MoreAdvertising Efficacy By Media, April 2013 [TABLE]
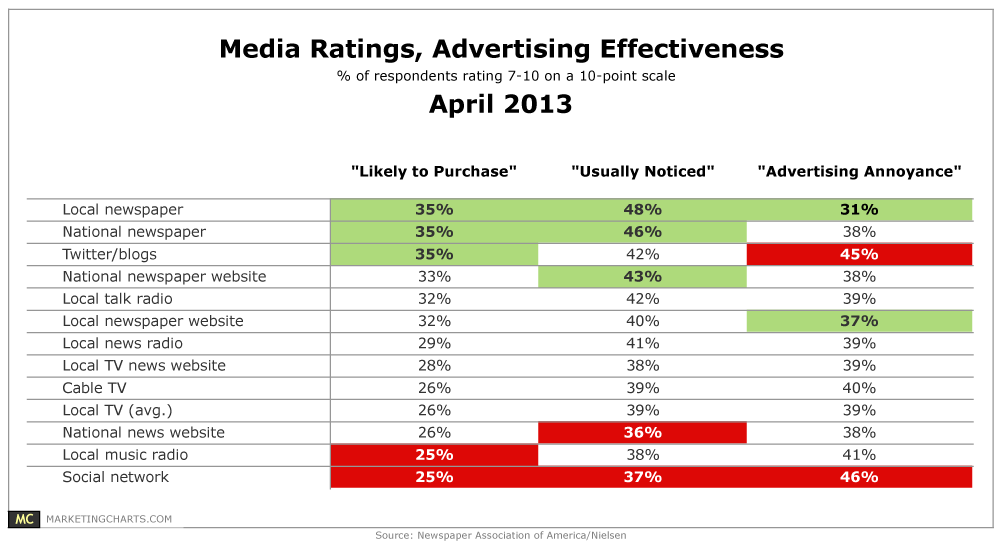
An online survey of 5,000 US adults reveals that respondents rate newspapers as the most effective advertising source among various media.
Read MoreBudget Increases For Online Video, 2012 vs 2013 [CHART]
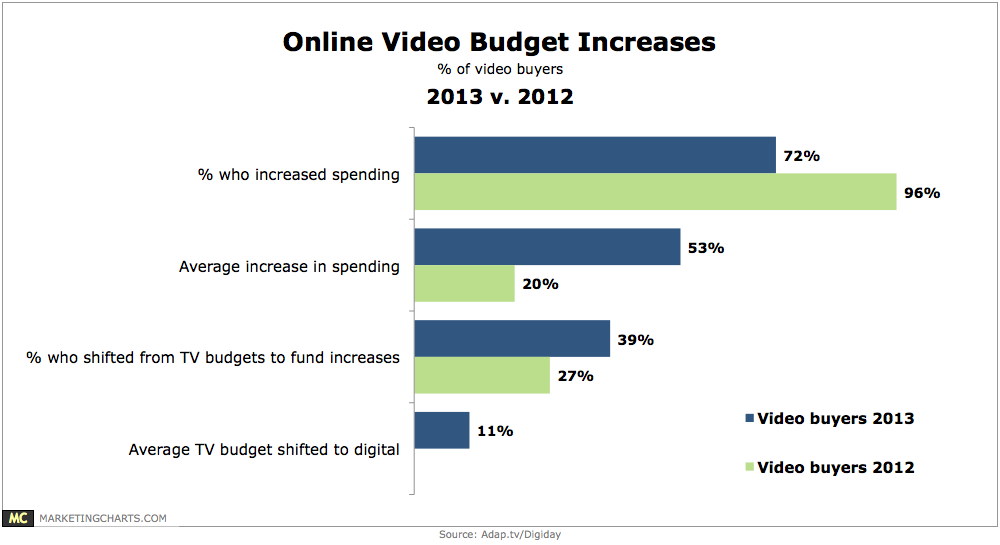
A recent study by Nielsen and the IAB recommended moving 15% of TV budgets to online video in order to increase reach at a lower cost.
Read MoreTop 10 TV Ads of Q1 2013 [TABLE]

Only 2 Super Bowl spots cracked the top 10, with Budweiser’s “Brotherhood” coming in at number 5.
Read MoreUS TV vs Digital Video Ad Spending, 2011-2017 [CHART]
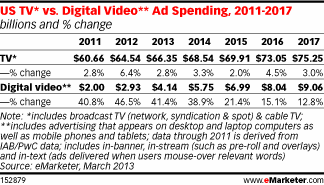
Spending on video ads served to PCs and mobile devices is expected to reach $4.14 billion this year, more than twice 2011 levels.
Read MoreUS Television vs. Online Ad Spending, 2011-2017 [CHART]
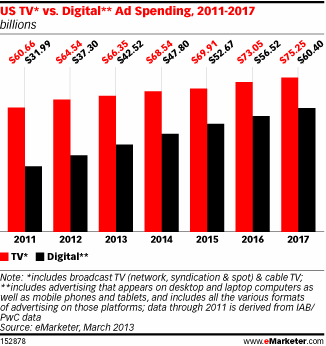
Advertisers will spend $66.35 billion on TV this year, up from $64.54 billion in 2012 and set to rise to over $75 billion by 2017.
Read MoreMost Influential Ad Type By Age, June 2012 [CHART]
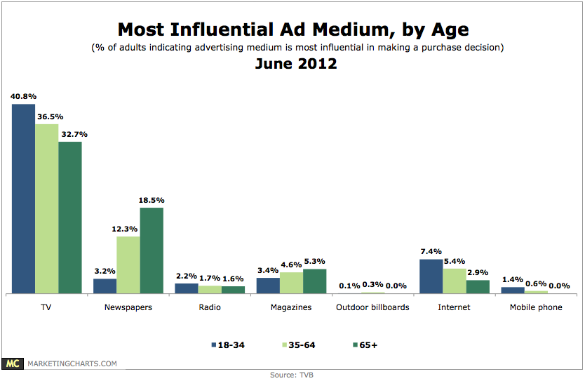
When asked the advertising medium they find most influential in making a purchase decision, 37.2% of American adults singled out TV – almost quadruple the proportion who pointed to the nearest competitor, newspapers (10.6%).
Read More