Television Advertising
US Hispanic Ad Spending By Media, 2011 & 2012 [TABLE]
Hispanic ad spending was up 11.1% last year, as US marketers spent nearly $8 billion on major media targeted toward Hispanic consumers.
Read MoreTV Viewers Who Would Never Act On A Commercial By Demographic, July 2013 [CHART]
41% of TV viewers say they would never act on a commercial, regardless of the device they’re using to watch TV.
Read MoreDigital Ad Agencies' Attitudes Toward TV & Online Video, July 2013 [TABLE]
Digital ad agencies believe that the effectiveness of TV advertising is on the decline, and are making a move to online video.
Read MoreTop 10 Most Effective Television Commercials Of Q2 2013 [TABLE]
AT&T Wireless took top honors on the new scale, outperforming the 12-month telecom services category norm by 23.9% with its “Whatever-Proof” spot.
Read MoreUS TV Ad Spending Growth vs Overall Average, Q1 2011-Q1 2013 [CHART]
TV is the largest ad spending medium in the US, and its growth rates appear to have outpaced the ad market as a whole for some time.
Read MoreGlobal Ad Spending Forecast By Medium, 2012 vs 2013 [TABLE]
Warc believes that global expenditures will now increase by 3.4% as opposed to an initial assessment of 4% growth made in January.
Read MoreConsumer Attitude Toward Ads On TV vs Original Streaming Video, January 2013 [CHART]
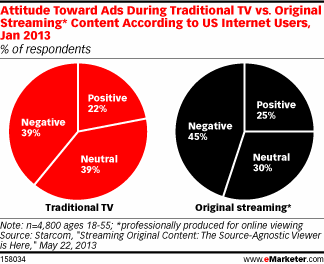
45% of consumers have a negative attitude to digital video ads vs. 39% who had negative opinions of ads shown on TV.
Read MoreDigital Video vs. TV For Awareness & Engagement, April 2013 [CHART]

Almost three-quarters of marketing professionals worldwide planned to increase their spending on branded video content or video ads in the next year.
Read MoreFactors That Influenced TV & VOD Consumption On Alternate Devices, June 2013 [CHART]
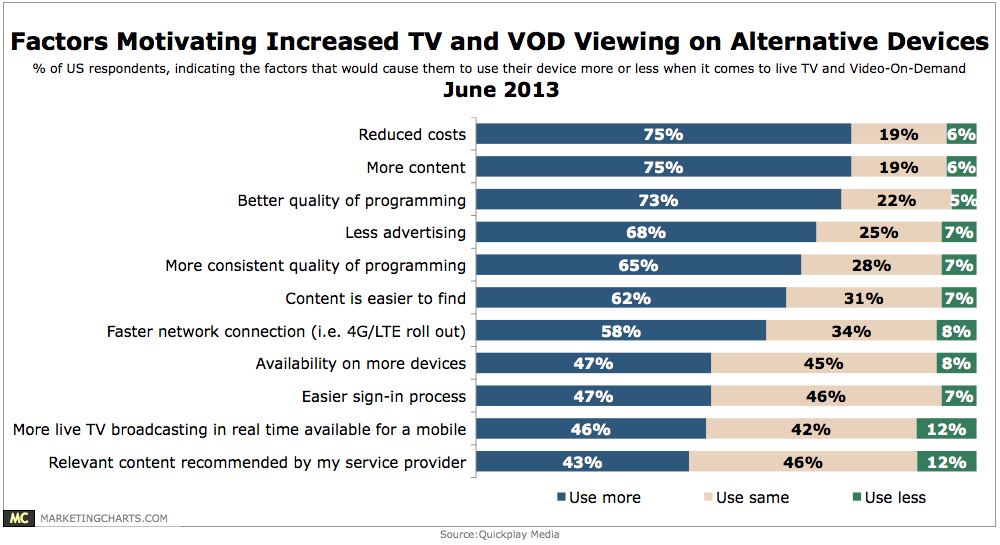
Roughly three-quarters of respondents in the US would be motivated to use their devices more for live TV and VOD viewing on account of reduced cost, more content, and better quality of programming.
Read MoreBest Sources For Marketing & Advertising, June 2013 [CHART]
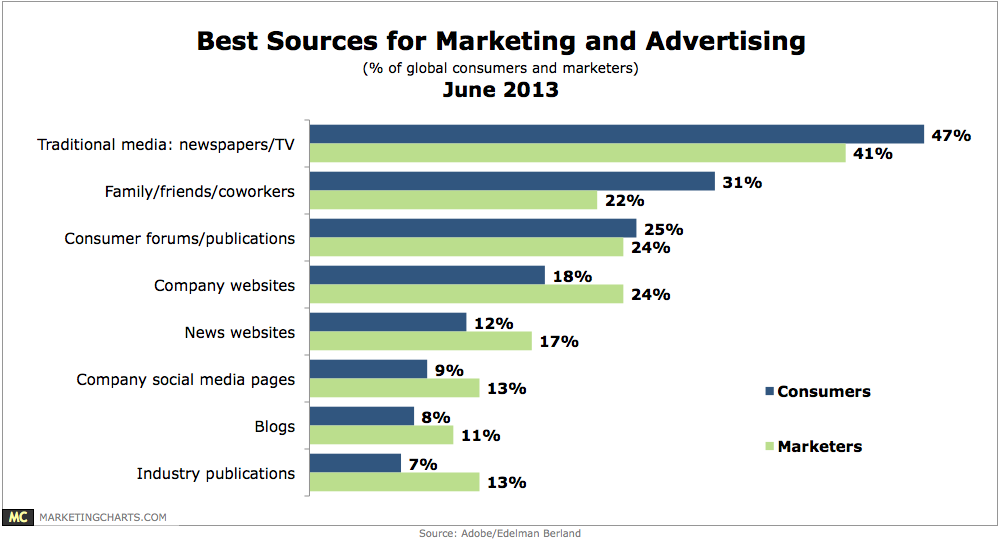
Consumers were more likely than marketers to choose traditional media sources such as newspapers and TV as best for advertising (47% vs. 41%), and also more likely to see their family, friends and co-workers as influential (31% vs. 22%).
Read More