Television Advertising
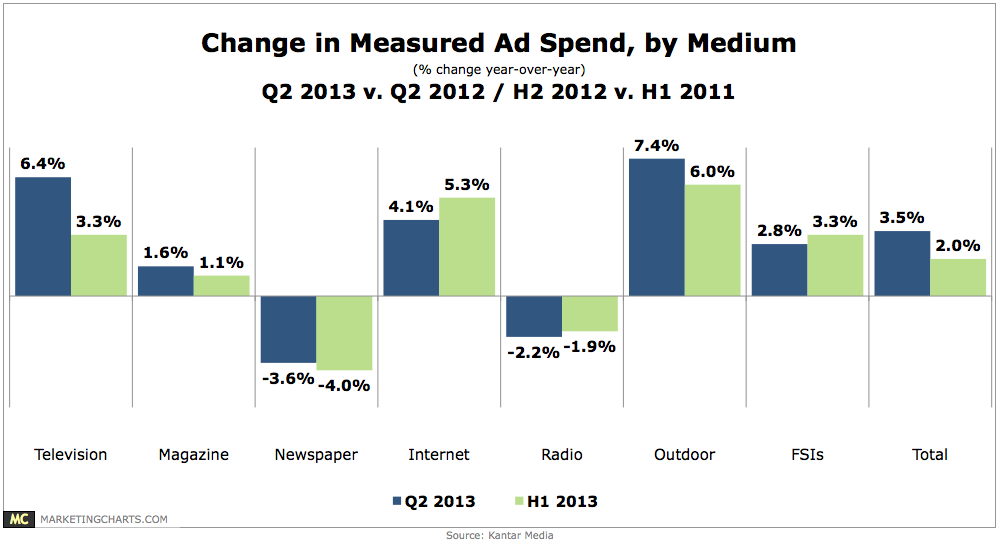
Changes In Ad Spending By Medium [CHART]
US ad spending increased by 3.5% year-over-year in the second quarter of the year to reach $35.8 billion, dragging first-half expenditures up by 2% to $68.9 billion.
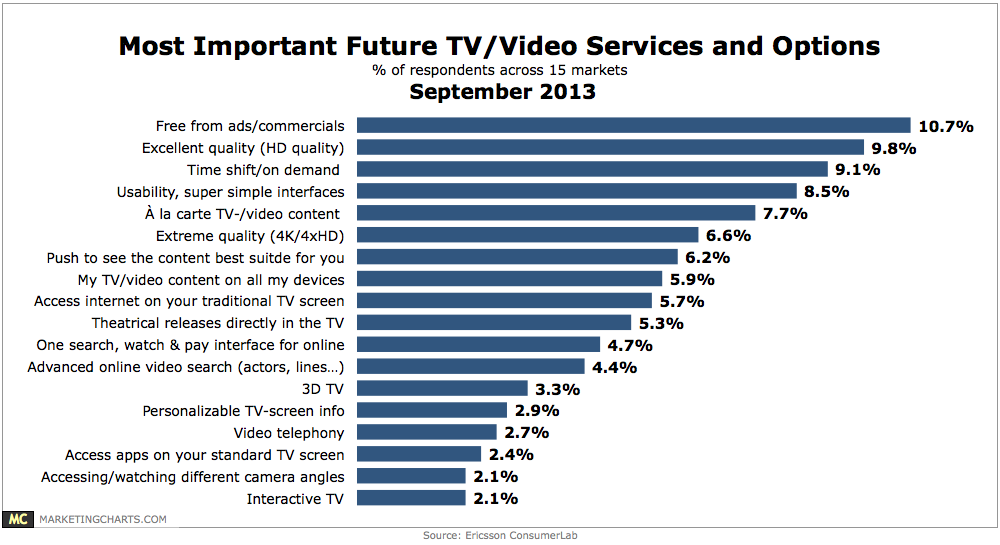
Read MoreMost Desirable Future TV/Video Services & Options, September 2013 [CHART]
A leading 10.7% share of TV viewers from around the world said they want their future TV experience to be free of ads.
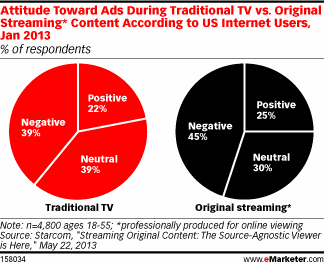
Read MoreAttitude Toward Ads During Traditional TV vs. Ads During Streaming Online Video, January 2013 [CHART]
US internet users had similar attitudes toward ads during traditional TV and original streaming content.
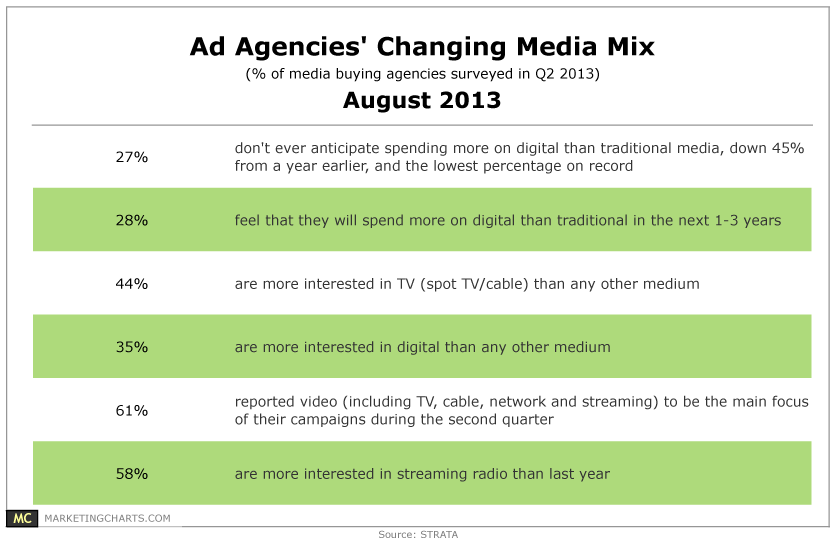
Read MoreAd Agencies' Changing Media Mix, August 2013 [TABLE]
Just 27% of media buying agencies don’t anticipate ever spending more on digital than traditional media.
Read MoreUS TV vs. Online Video Ad Spending, 2011-2017 [TABLE]
Even with the rapid rise of digital video viewership and ad spending, levels of spending on online and mobile video fall far below spending on TV.
Read MoreUS Total Ad Spending By Media, 2011-2017 [TABLE]
eMarketer expects TV to continue to capture the largest share of paid ad spending in the US for the foreseeable future, though its percentage of total spending will drop slightly, from 39.1% in 2012 to 38.8% this year.
Read MoreLikelihood Of TV Ad Spending Shifting To Online Video, June 2013 [CHART]
eMarketer expects US digital video ad spend to rise by 41.4% this year and by nearly 40% next year as well, when outlays will reach $5.7 billion.
Read MoreChanges In B2B Marketing Spending During Next Year, March 2013 [TABLE]
45% B2B marketers expected to increase search engine advertising spending.
Read MoreGlobal Ad Spending Growth By Medium, Q1 2013 [CHART]
Ad spending on TV around the world grew by 3.5% in Q1, outpacing the aggregate increase of 1.9%.
Read MoreWhy People Watch TV Commercials By Genre, July 2013 [CHART]
The quality of the editorial content also appears to be a bigger influence on viewers than the quality of the ad.
Read More