Television Advertising
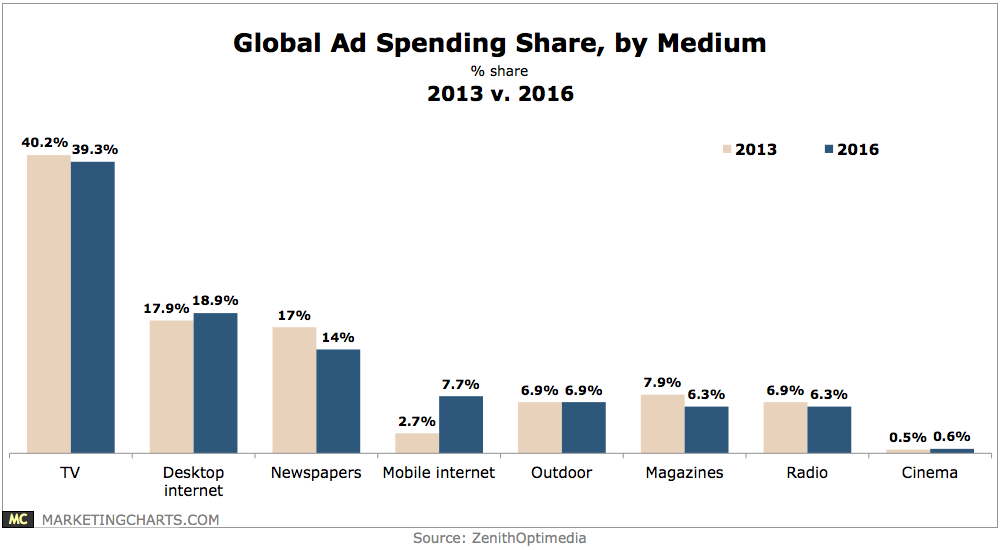
Global Ad Spending Share By Medium, 2013 vs 2016 [CHART]
ZenithOptimedia predicts mobile advertising will generate more new ad spending ($31.8 billion) than TV ($29.8 billion) from this year through 2016.
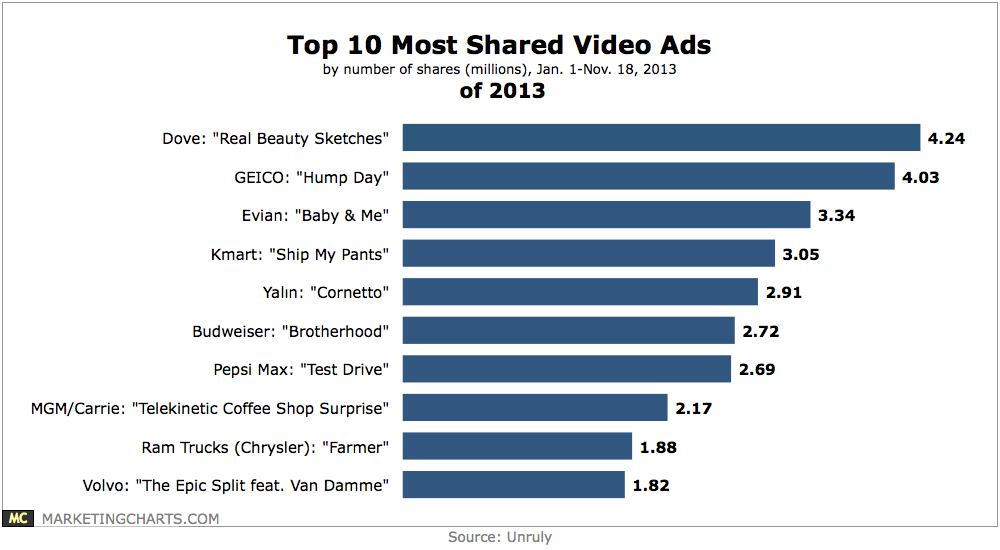
Read MoreTop 10 Most Shared Video Ads Of 2013 [CHART]
Dove’s 3-minute Real Beauty Sketches takes the top honors for the study period (January 1 through November 18), generating 4.24 million social shares since its April launch.
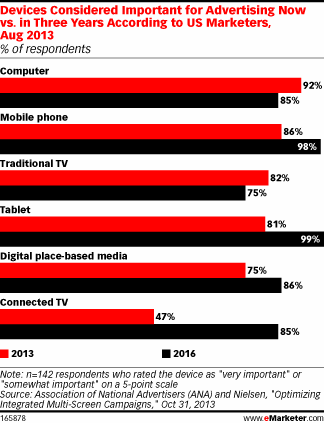
Read MoreDevices Marketers Consider Important For Advertising, 2013 & 2016 [CHART]
While 86% of respondents said mobile phones were currently important advertising channels, 98% said they expected them to be important in three years’ time.
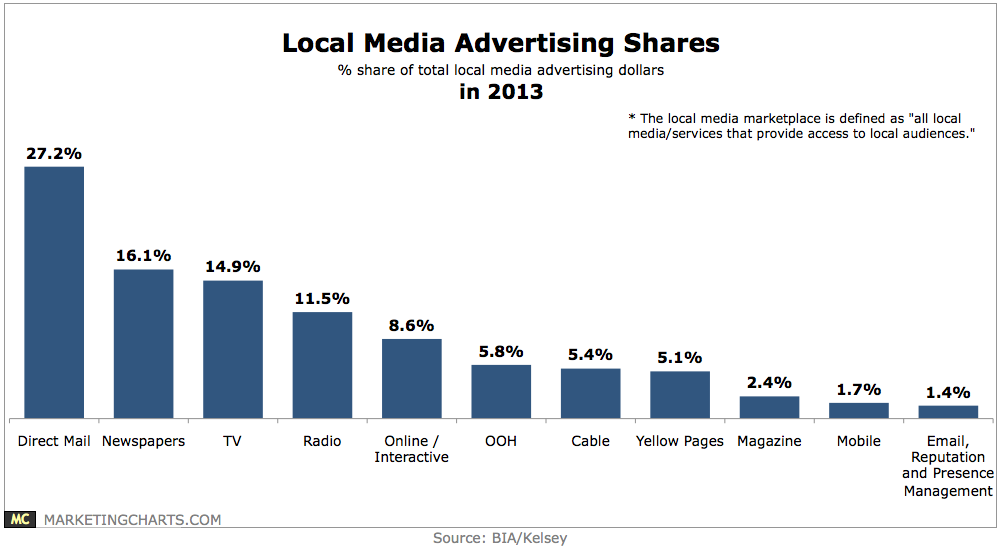
Read MoreLocal Advertising Revenue Shares By Channel, 2013 [CHART]
BIA/Kelsey estimates total advertising spending on local media this year to be $132.7 billion.
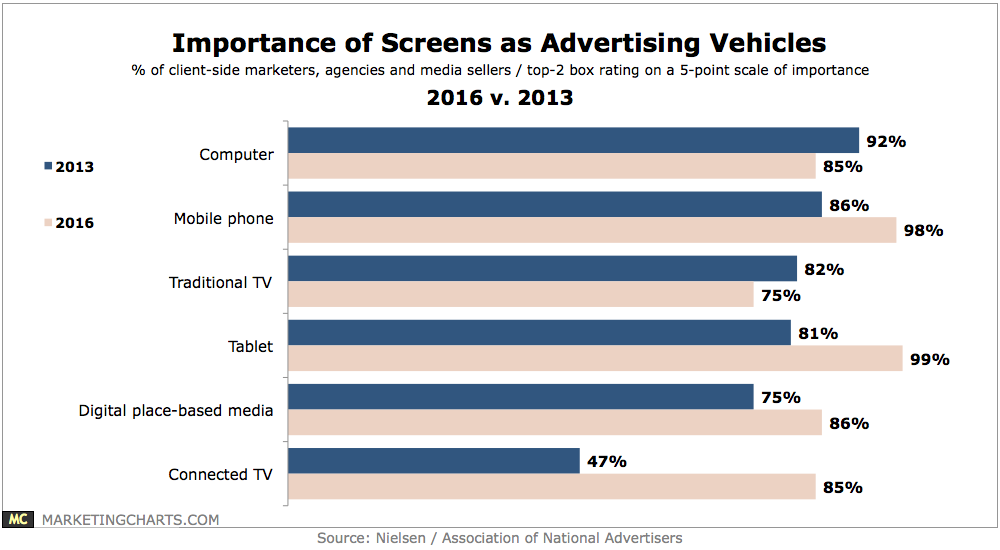
Read MoreImportance Of Screens As Advertising Vehicles, 2013 vs 2016 [CHART]
In 3 years’ time, mobile phones and tablets will be more important advertising screens than the traditional TV.
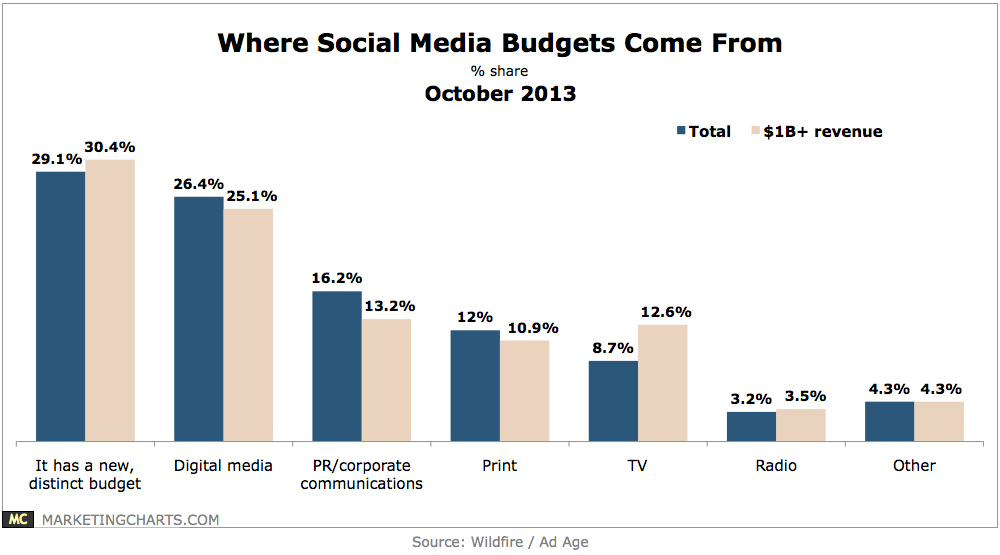
Read MoreWhere Social Media Budgets Come From, October 2013 [CHART]
Roughly 30% of respondents’ social media budgets are incremental, meaning that social has its own new and distinct budget.
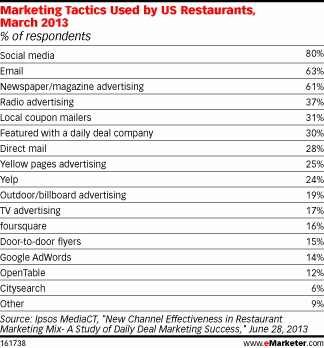
Read MoreMarketing Tactics Used By American Restaurants, March 2013 [TABLE]
Among US restaurants in March 2013, 80% used social media—17 percentage points higher than email, which was the next most popular choice.
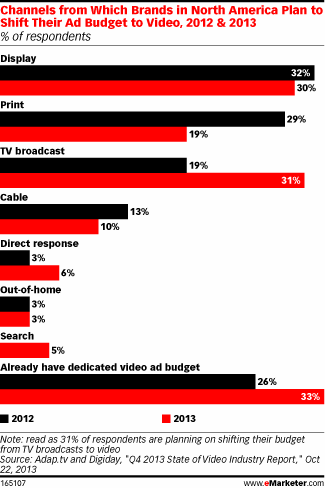
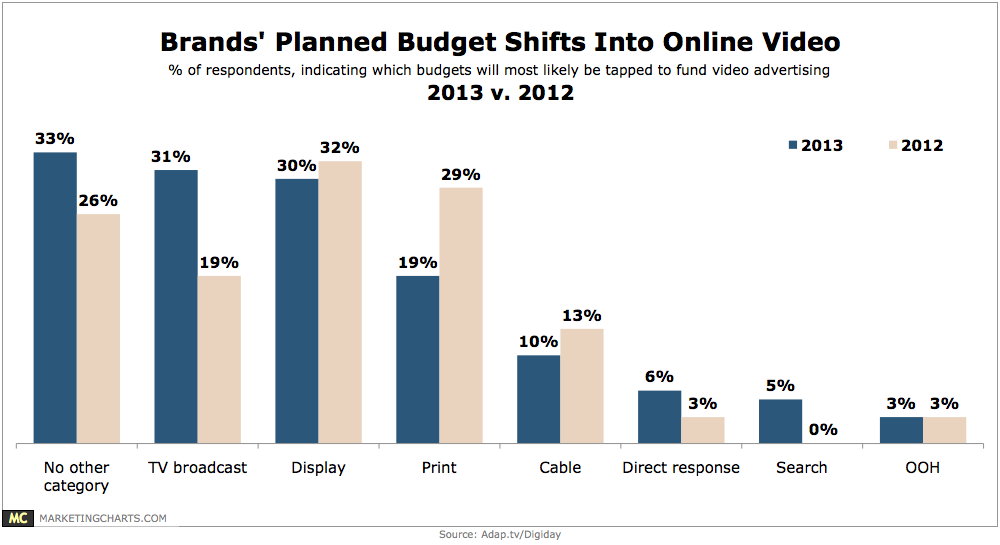
Read MoreChannels From Which Brands Plan To Shift Ad Budgets To Video, 2012 & 2013 [CHART]
31% of brands that responded were planning to shift their advertising budgets away from broadcast television and into online video.
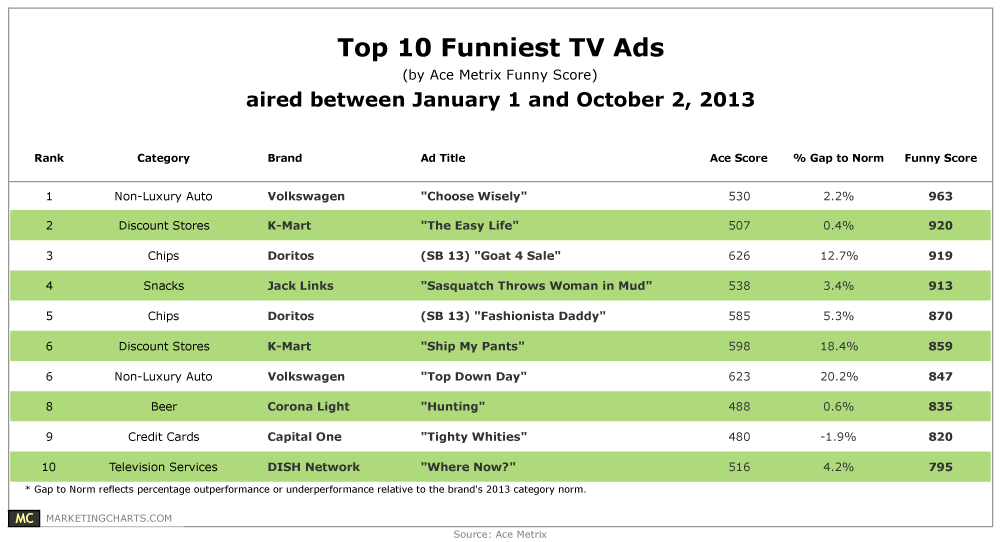
Read MoreThe 10 Funniest TV Ads, January 1 – October 2, 2013 [TABLE]
About 1 in 5 ads can be identified as “funny.”
Read MoreBrands Planned Budget Shifts Into Online Video, 2012 vs 2013 [CHART]
Brands reported an average 65% increase in video ad spending this year over last, with agencies upping their expenditures by 83%.
Read More