Television Advertising
US Media Ad Spending Share By Media, 2012-2018 [CHART]
TV will remain the dominant advertising channel, making up 38.1% of total media spending in 2014.
Read MoreSources UK Online Shoppers Used To Research Products, December 2013 [CHART]
Only 10% of respondents consulted social networks when researching potential purchases.
Read MoreAuto Ads That Prompted Consumer Research, May 2013 [CHART]
At the start of the purchase path, mobile, tablet and video ads each laid claim to prompting 34% of buyers to start researching vehicles,
Read MoreAmericans' Video Viewing Habits, March 2014 [TABLE]
53% of respondents to the survey agreed that they record live video content in order to skip ads.
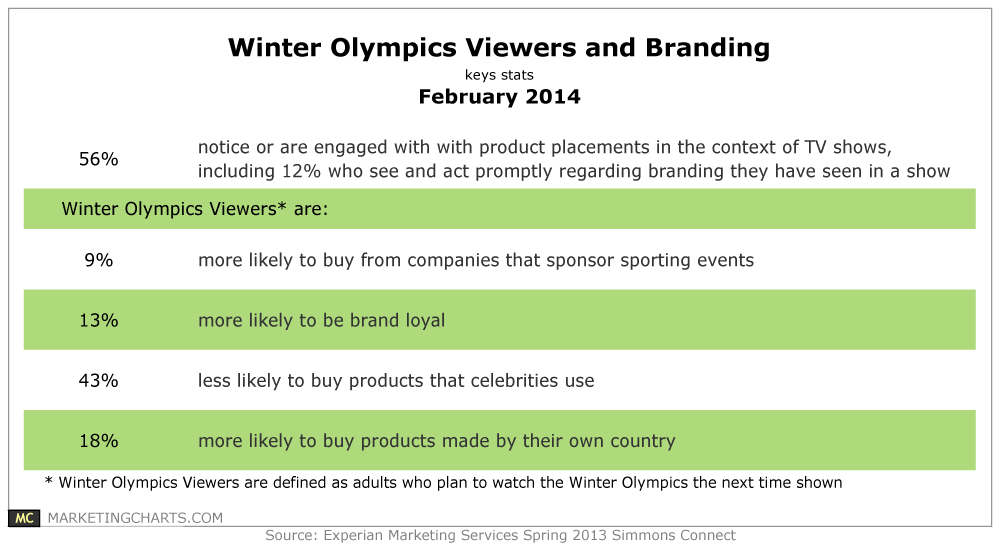
Read MoreWill Olympics Viewers & Branding, February 2014 [TABLE]
Winter Olympics viewers are quite receptive to branded messaging on TV.
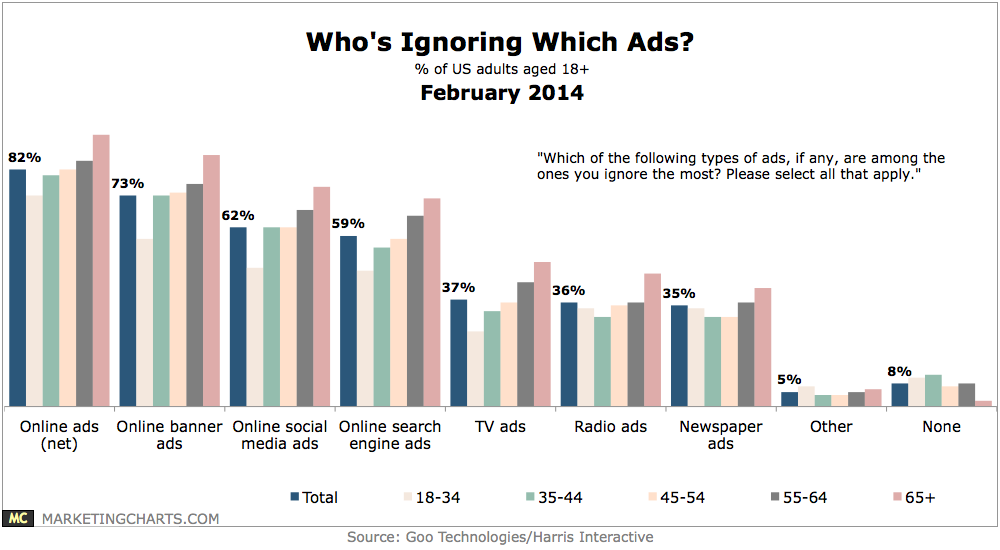
Read MoreAds People Most Ignore, February 2014 [CHART]
Online ads are ignored by the largest share of respondents (82%), with traditional media ads such as TV ads (37%), radio ads (36%), and newspaper ads (35%) a fair way behind.
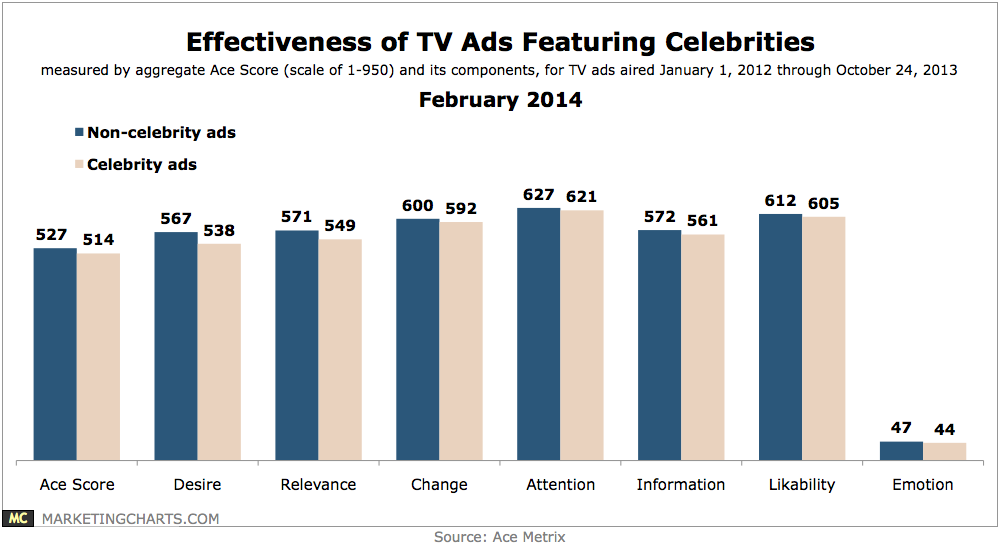
Read MoreEffectiveness Of TV Ads Featuring Celebrities, February 2014 [CHART]
Based on advertising data gathered from the beginning of January 2012 through October 2013, Ace Metrix found that in the aggregate, TV ads containing celebrities underperformed those without.
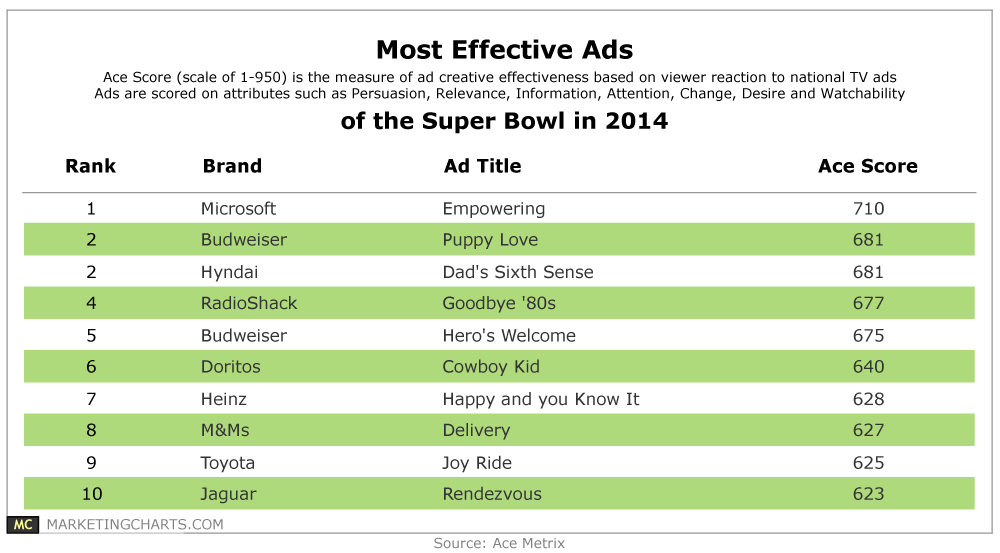
Read MoreMost Effective Super Bowl 2014 Commercials [TABLE]
With a record average of 112.2 million viewers for the game, per Nielsen’s adjusted tally, brands had an opportunity to reach the largest TV audience ever recorded.
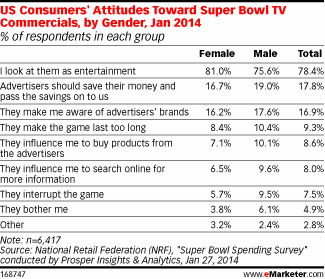
Read MoreAmericans Attitudes Toward Super Bowl Ads By Gender, January 2014 [TABLE]
US adults will spend an average $68.27 on Super Bowl-related items.
Read MoreAffluent Super Bowl Audiences, 2003-2013 [CHART]
The Super Bowl audience has numbered more than 50 million TV homes over each of the past 4 big games.
Read More