Television Advertising
TV Binge-Viewers Attitudes Toward Advertising, July 2014 [CHART]
Roughly 6 in 10 binge-viewers (defined as TV viewers who watch at least 3 episodes of the same TV show in one sitting) agree that they enjoy binge-viewing because they don’t have to watch ads.
Read MoreTypes Of Advertising To Which College Students Pay Attention, July 2014 [CHART]
Much like the population-at-large, college students pay a considerable amount of attention to recommendations from friends and family.
Read MoreTV Commercial Viewing Frequency, July 2014 [CHART]
TV multitasking is on the increase, and some 82% of US adults at least occasionally go online while watching TV.
Read MoreTotal US Ad Spending Share By Media, 2012-2018 [TABLE]
US adults will spend an average of 2 hours 51 minutes per day with mobile devices this year.
Read MoreConsumer Attitudes Toward Ads, June 2014 [CHART]
Almost 6 in 10 regular viewers of local TV news agree that they rely on local TV news for product and service ideas that are relevant to them in their lives.
Read MoreChange In Ad Spending By Medium, Q1 2014 [CHART]
Total ad expenditures in Q1 grew by 5.7% year-over-year to $34.9 billion, boosted by the Winter Olympics, which added an incremental $600 million in spending.
Read MoreGerman Ad Spending By Media, 2010-2013 [TABLE]
German ad spending is expected to rise 2% in 2014.
Read MoreMarketing Expenditures In The Next 5 Years [INFOGRAPHIC]
This infographic is based on data from an Accenture CMO study and illustrates where they thing their marketing dollars will be spent in the next five years.
Read MoreUS Ad Spend Growth By Medium, 2013 vs 2014 [CHART]
Digital media advertising grew to be larger than national TV ad spend last year.
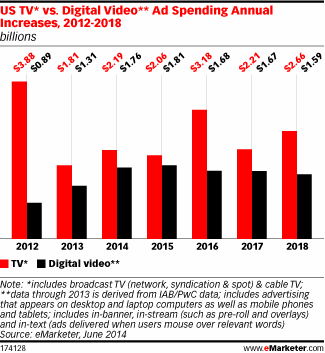
Read MoreUS TV vs. Online Ad Spending Increases, 2012-2018 [CHART]
Despite digital video’s astronomical rise percentagewise, eMarketer projects that TV will add more new dollars this year.
Read More