Television Advertising
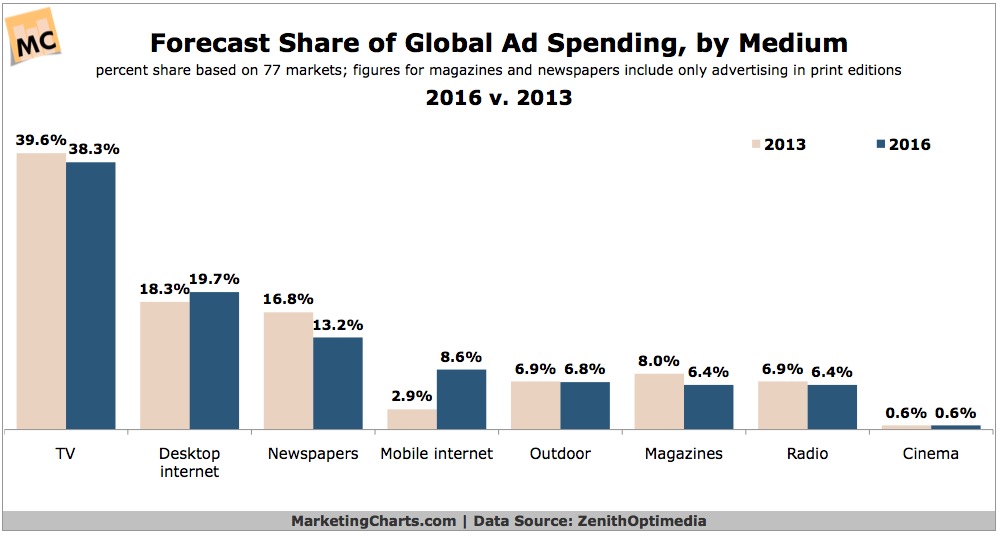
Global Ad Spend Share Forecast, 2013 vs 2016 [CHART]
Mobile is the fastest-growing advertising medium around the world.
Read MoreInfluence Of TV Ads, Online Ads & Social Chatter, September 2014 [CHART]
43% of US internet users said that social media chatter had the most influence on what they bought, where they ate or the movies and TV shows they watched.
Read MoreData-Driven TV Ad Campaigns, September 2014 [CHART]
Brands estimate allocating 60% of their video budgets to programmatic channels versus traditional or direct publisher sales.
Read MoreNielsen’s Top 10 DMAs, 2014-2015 [CHART]
The number of TV homes overall decreased by 1.7% year-over-year to roughly 113.8 million, per Nielsen’s estimate.
Read MoreBudget Shifts To Fund Video Advertising, September 2014 [CHART]
Video ad buyers are most likely to be drawing from display budgets to fund spending increases in the next 12 months.
Read MoreShare Of Average Time Spent Per Day With Select Media vs Ad Spending Share, 2014 [TABLE]
Looking at various activities within the digital landscape, time spent generally outpaces ad spending across the board.
Read MoreUS College Students' Back-To-School Purchase Influences, August 2014 [TABLE]
Some 93.6% of college students said they found one-on-one recommendations from friends at least somewhat influential.
Read MoreChange In Ad Spending By Medium, Q2 2014 & H1 2014 [CHART]
US ad spending inched up by 0.7% year-over-year in the second quarter to reach $35.6 billion, dragging down the growth rate for first-half expenditures to 3.1%.
Read MoreChannels US Ad Execs Use For Programmatic Buying, June 2014 [CHART]
Programmatic TV advertising is still in its infancy due to limited buyer and seller adoption and lack of standardization of technology and infrastructure.
Read MoreImportance Of Offering Traditional TV & Online Video Multiplatform Package, April 2014 [CHART]
Enthusiasm for cross-platform video buying, particularly the ability to bridge digital video and TV, is high.
Read More