Technographics
North & Latin American Navigation Service Subscribers, 2016 [TABLE]
By 2016, navigation systems will support 18.7 million subscribers in North America, while smart phone navigation will boast more than 400 million.
Read MoreGlobal Connected-Car System Shipments, 2012 & 2016 [CHART]
More than 105.6 million people drove to work solo in 2011, according to US Census data. This figure represented 76.4% of all employed people in the US over the age of 16.
Read MoreTop 3 Activities Moving From Desktop To Mobile, February 2013 [TABLE]
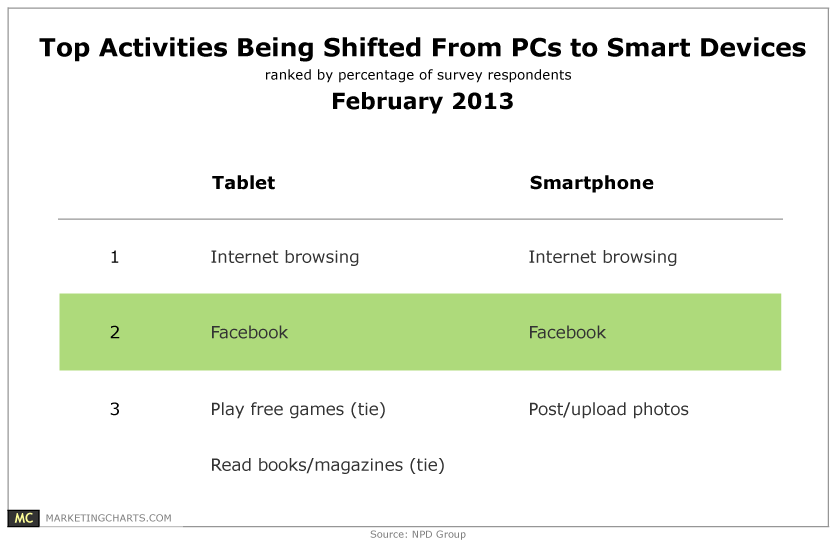
Almost 4 in 10 PC users are now accessing content on their tablets and smart phones instead of their desktops.
Read MoreeCommerce Traffic From Smart Devices, Q3 2011 – Q4 2012 [CHART]
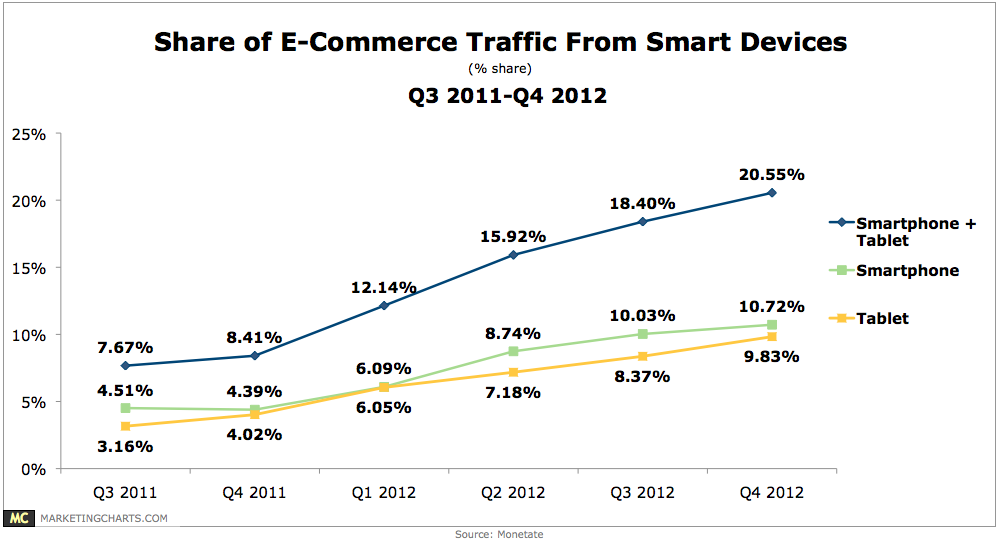
Traffic from smart phones has jumped from 4.1% share of online shopping sessions in Q4 2011 to 10.7% in Q4 2012, while tablets’ share of eCommerce traffic has grown from 4.1% to 9.8%.
Read More
Smart Phone Share Of US Mobile Market, October 2011 – December 2012 [CHART]
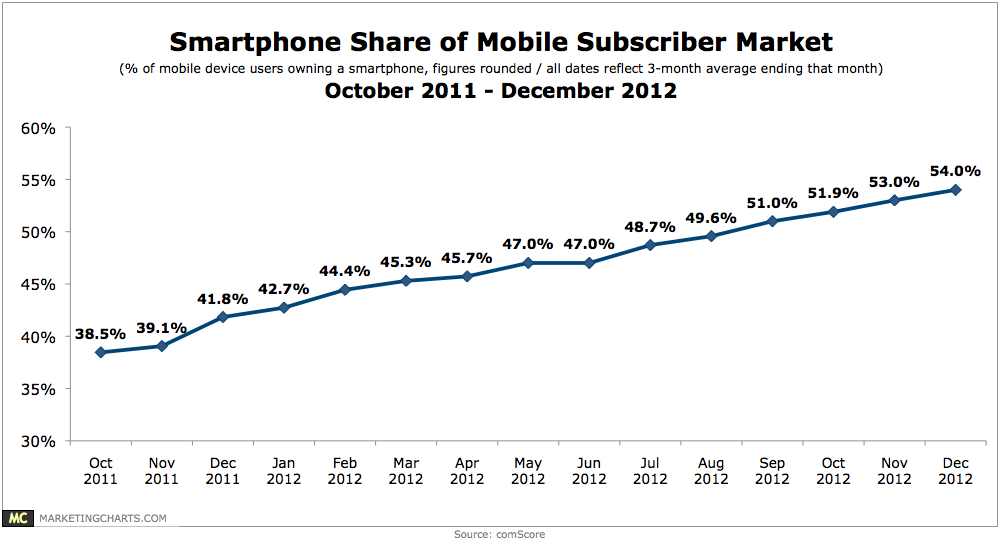
During the 3-month average ending in December 2012 (Q4), 54% of US mobile subscribers owned a smart phone, a 19.2% rise from the 3-month average ending March 2012 (Q1 – 45.3%).
Read MoreTop Mobile App Types For Data Consumption, September-December 2012 [CHART]
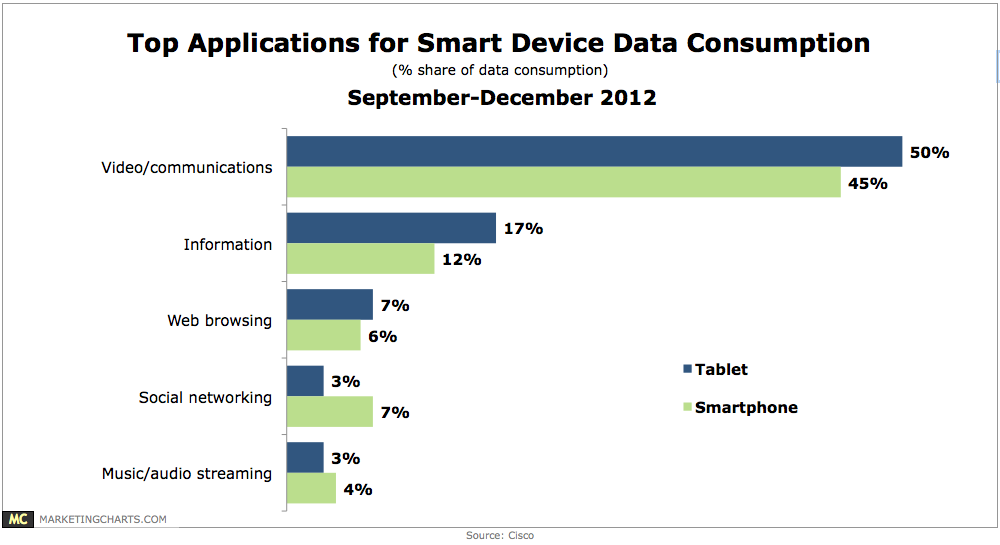
Video streaming and communications applications such as YouTube, Hulu, and Netflix accounted for exactly half of data consumption on tablets, and 45% on smartphones.
Read More
Consumers Who Would Consider Replacing Laptop With Tablet By Demographic, 2013 [CHART]
18- to 44-year-olds were significantly less likely than older people to expect to use the computer most often—in many cases citing smartphones or tablets instead.
Read MoreDevices People Use To Consume News & Entertainment By Demographic, 2013 [CHART]
In the 18- to 34-year-old demographic in particular, TV’s edge is slipping.
Read More