Technographics
Affluents' Multi-Screen Behavior, March 2013 [TABLE]
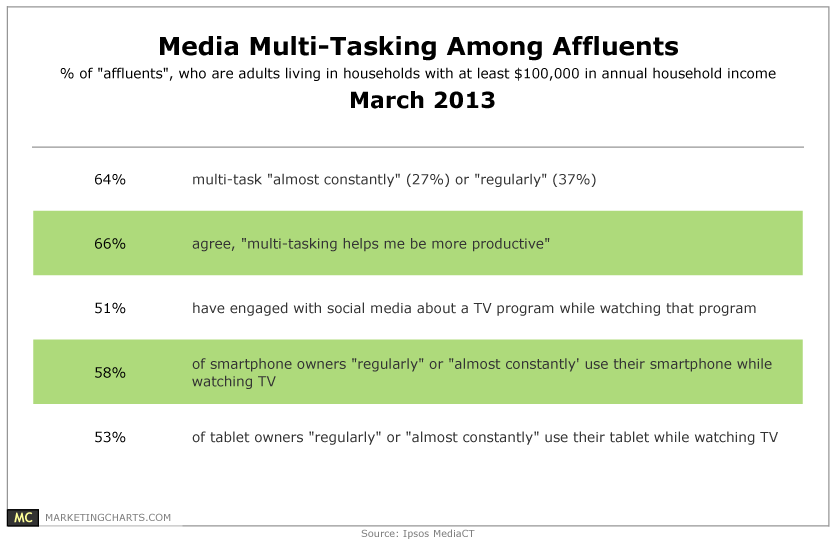
51% of affluents have engaged with social media about a TV program while watching that program.
Read MoreMobile Internet Use By Device Type, 2011-2013 [CHART]
Tablets accounted for just 7% of traffic on the Jumptap network in 2011, half the share accounted for by feature phones.
Read More
Time Spent Watching Long Online Videos By Device, Q4 2012 [CHART]
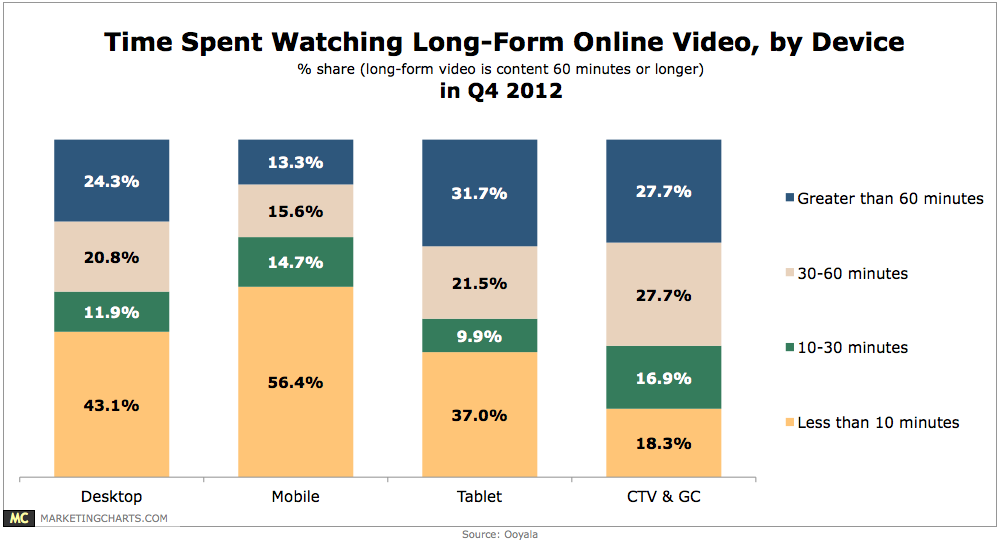
In Q4 2012, 53.2% of time spent watching tablet video was with content running at least a half-hour in length.
Read MoreCost per Loyal Mobile App User Index, June 2012 – January 2013 [CHART]
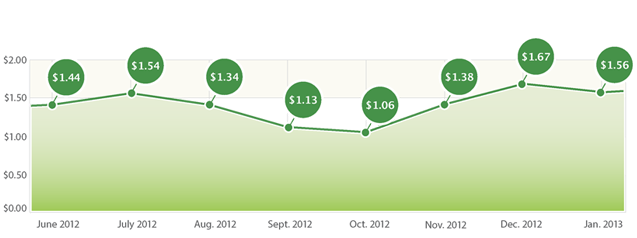
The Cost per Loyal Mobile App User Index measures the cost of acquiring a loyal user for brands who proactively market their apps.
Read MoreMobile Enterprise [INFOGRAPHIC]
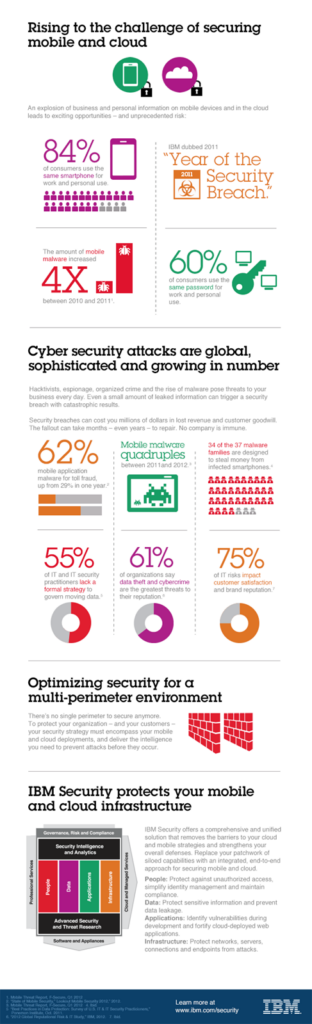
While 84% of consumers now use their personal smart phones for work, mobile malware has increased more than four times since 2010.
Read MoreTime Spent On Mobile vs. PC By Website Type, April 2013 [CHART]
This graphic from comScore illustrates time spent on the Internet using a PC vs. mobile.
Read MoreHoliday Multi-Screen Shopping, 2012 [TABLE]

63% of shoppers used multiple devices to help with their holiday purchases last year.
Read MoreMobile Operating System Market Share, 2011 vs 2012 [CHART]
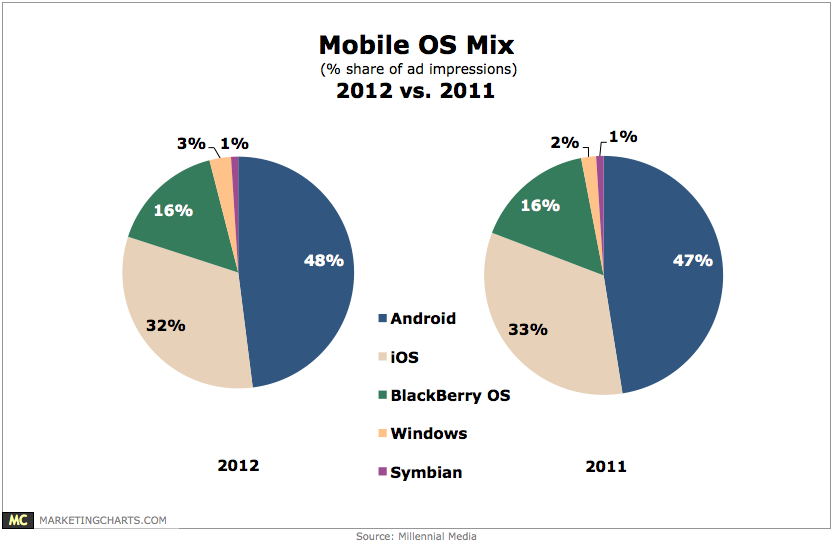
With 75% share of total ad impressions, the smart phone share grew by 7% points from 2011.
Read MoreGlobal Smart Device Market Penetration By Country, January 2013 [CHART]
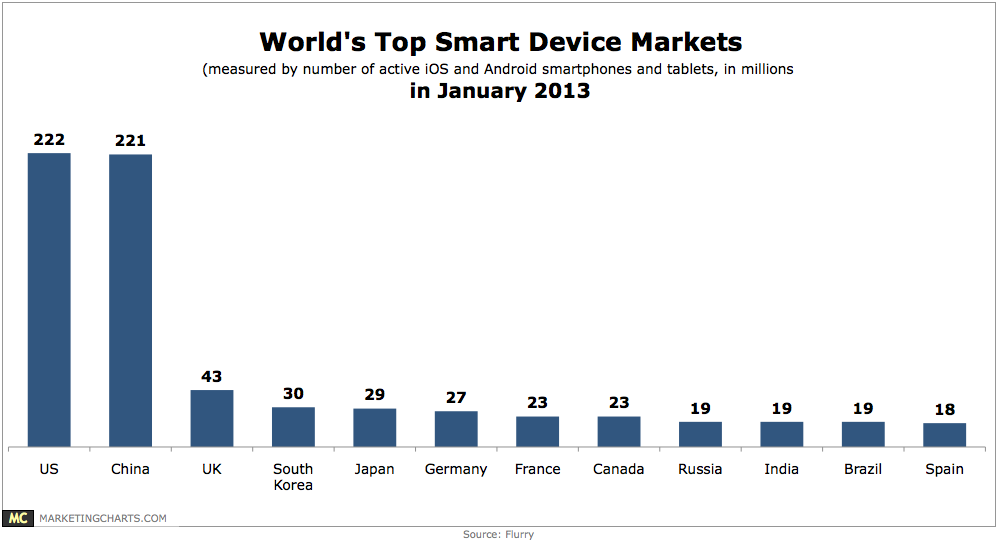
China became the largest market this month, surpassing the US for the first time.
Read More