Technographics
Proximity Of Mobile Phones To Their Owners, April 2013 [CHART]
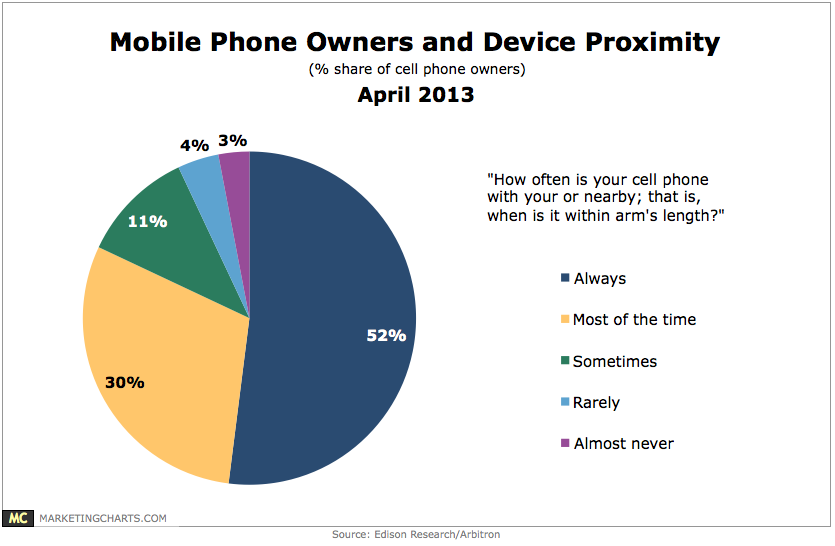
52% of mobile phone owners always keep their device within arm’s reach, and another 30% do so most of the time.
Read MoreOnline Viewership For Broadcast TV, March 2013 [TABLE]
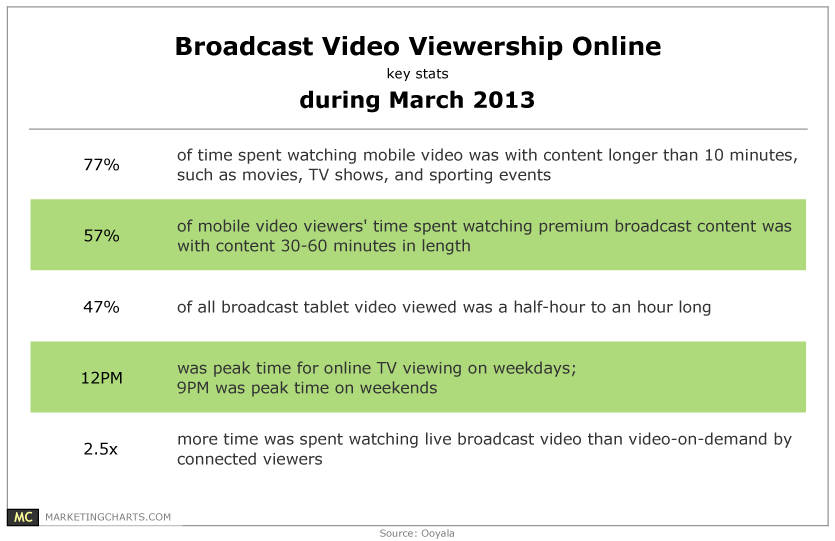
Connected viewers watched live broadcast video 2.5 times longer than video on demand (VOD), while 77% of time spent watching mobile video was with content longer than 10 minutes, such as movies, sporting events, and TV shows.
Read MoreAmericans' Daily Media Consumption, 2012 vs 2013 [CHART]
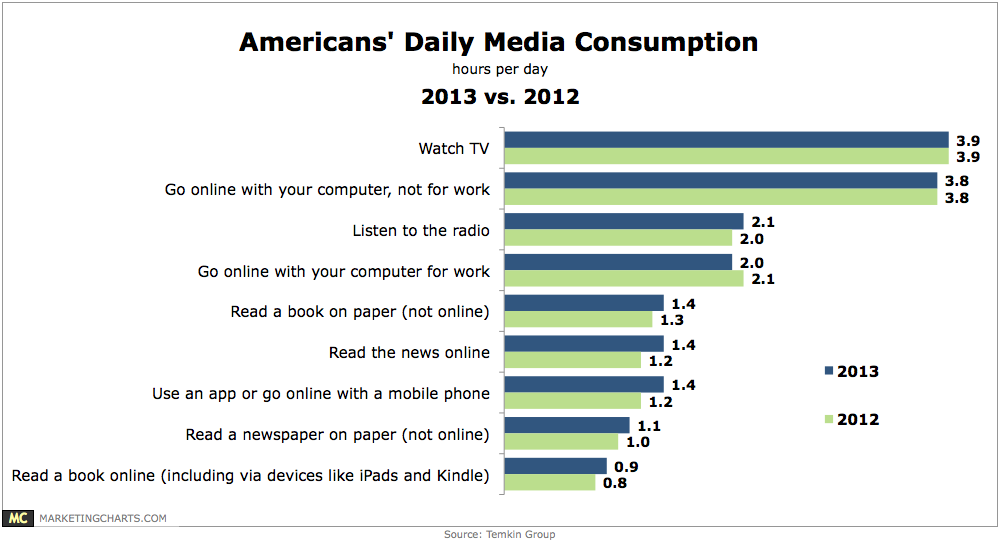
Americans are holding steady in terms of their TV consumption and non-work-related internet use, but are spending more time with other activities such as reading books and accessing the internet via a mobile device.
Read MoreMobile Device Use By Activity & Device Size, February 2013 [CHART]
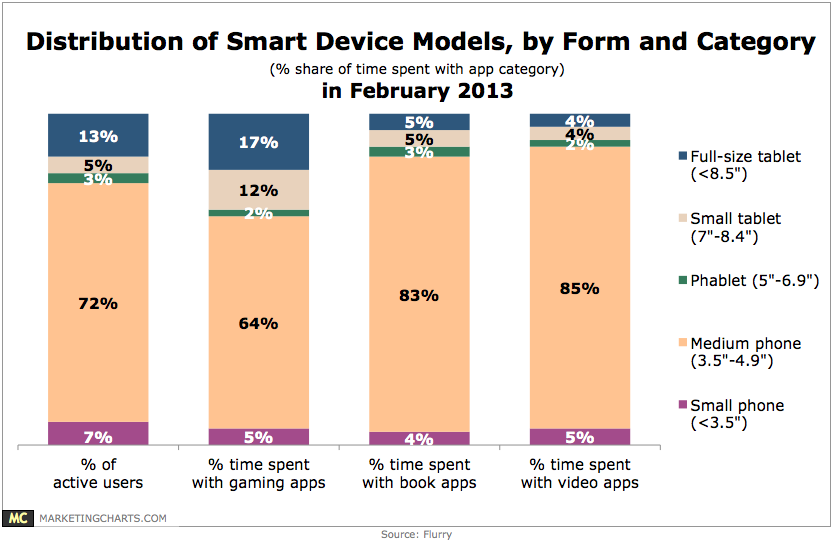
While small (5%) and full-size (13%) tablets accounted for less than 20% of active smart device users around the world, they represented 29% of time spent playing gaming applications on such devices in February 2013.
Read MoreSmart Phone Use To Begin The Day, March 2013 [CHART]
89% of 18-24-year-old smart phone owners reach for their device within 15 minutes of waking up, and 74% reach for it immediately after waking up.
Read MoreWhere People Consume Text & Video Content, March 2013 [CHART]
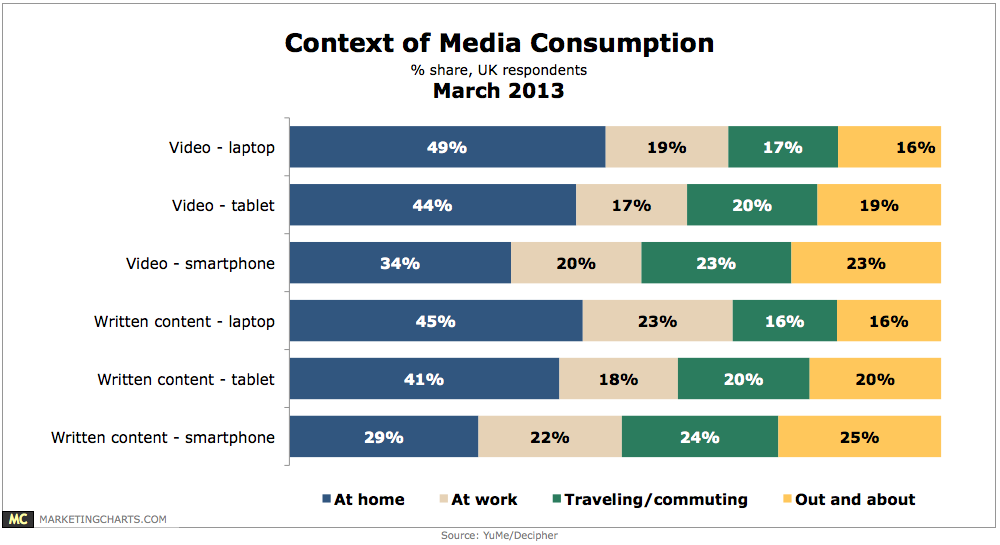
Regardless of device, consumption of videos takes place most often in the home and users are both more relaxed and explorative while at home.
Read MoreLocal Business Searches Resulting In Purchase By Device, March 2013 [CHART]
Almost 86 million people use their mobile phones to seek local business information in the US.
Read MoreNorth American Mobile Browsing By Daypart, March 2013 [CHART]
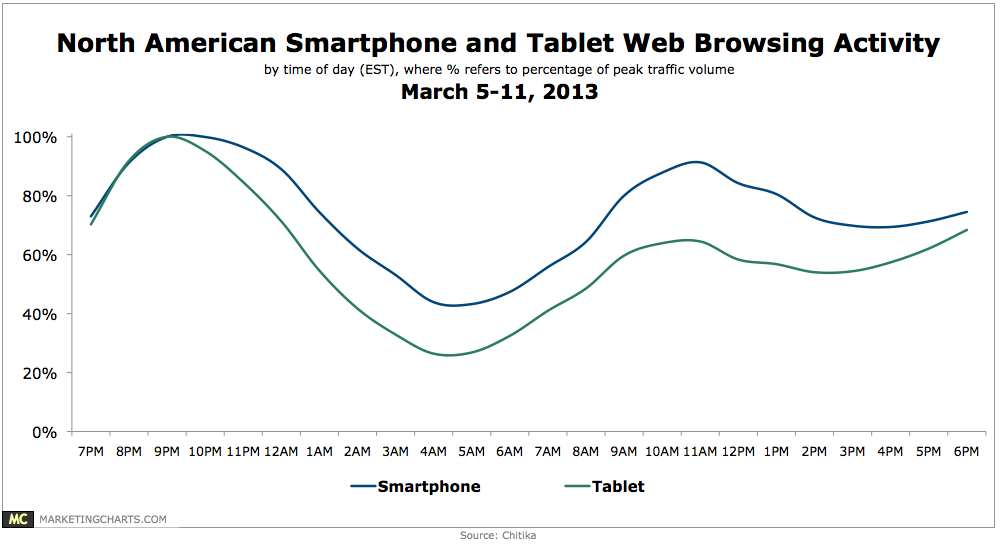
A study of web browsing by time of day shows that smart phone and tablet usage in North America peaks at 9 PM, whereas desktops reach their highest levels during the workday.
Read MoreNews Consumption Time By Device, March 2013 [CHART]
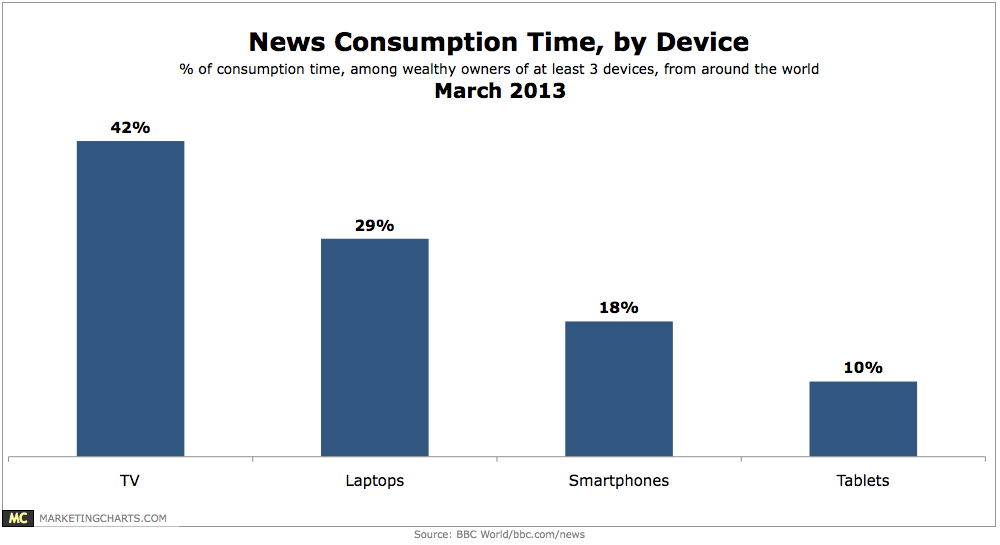
TV is still the primary device for news consumption, at 42% of respondents’ time, compared to 29% for laptops, 18% for smartphones, and 10% for tablets.
Read MoreDemographics Of Mobile Social Media App Users By Time Spent, March 2013 [CHART]
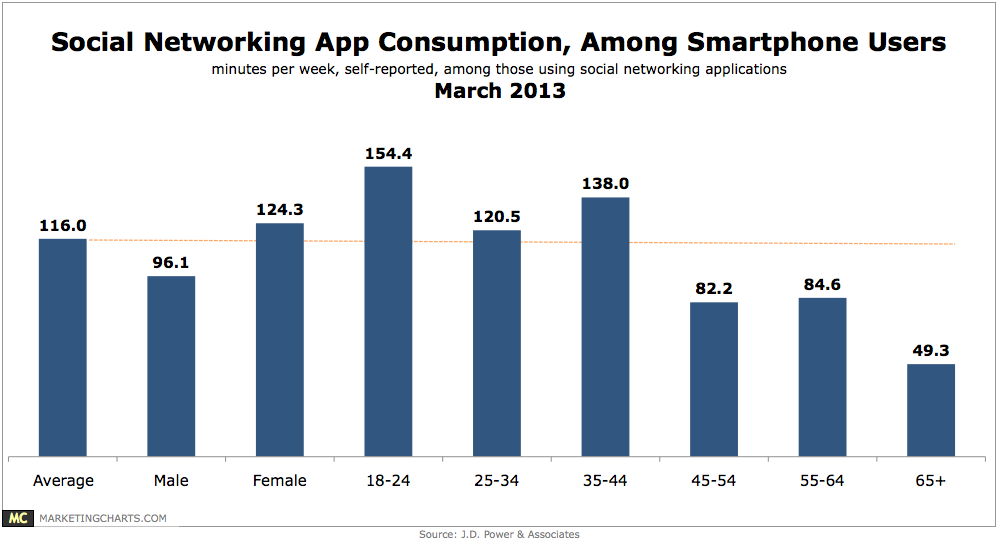
Female smart phone owners report spending a little more than 2 hours a week using downloaded social networking applications, compared to slightly more than 1-and-a-half hours for men, (124 minutes vs. 96 minutes).
Read More