Technographics
Mobile Share Of Search Traffic, Q1 2013 [CHART]
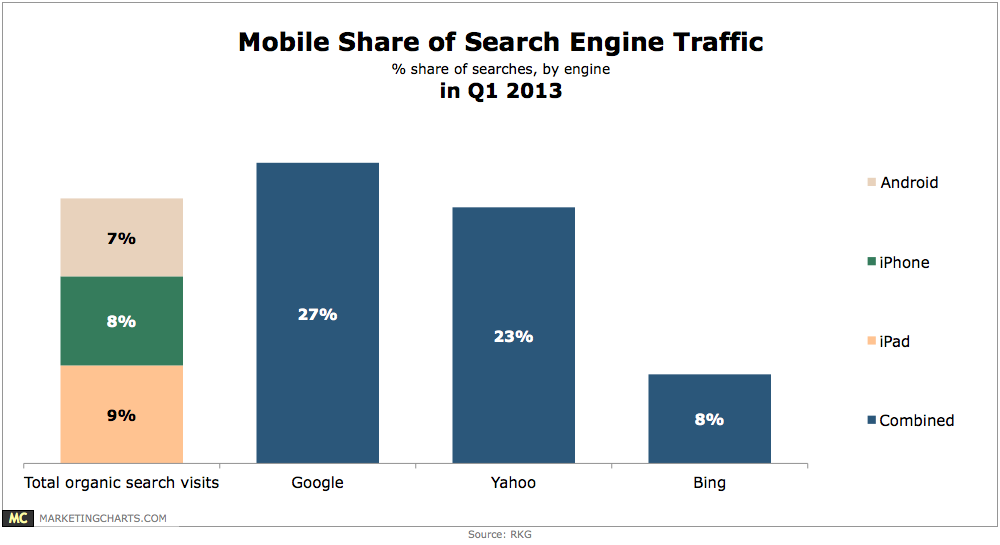
Tablets and smart phones combined accounted for roughly 24% of organic search visits in Q1.
Read MoreBroadcast TV Content Completion Rates Online By Device, 2012 [CHART]
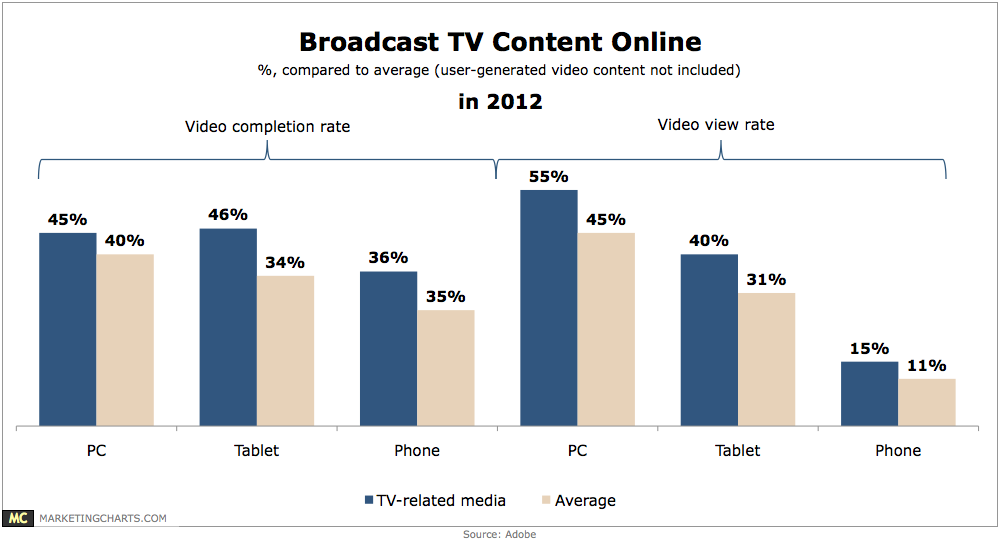
Compared to the average, completion rates for TV-related content (such as full episodes of TV shows) are 12.5% higher on PCs (45% vs. 40%), 31.4% higher on tablets (46% vs. 35%), and 33.3% higher on mobile phones (36% vs. 27%).
Read MorePopular Features Of Local Business Search Sites By Device, December 2012 [TABLE]
Around 77% of those who conducted a local search on either a mobile phone or tablet went on to make a purchase either in-store, online or over the phone.
Read MoreTop Mobile Apps Used For Local Business Search, December 2012 [TABLE]
Google Maps was the No. 1 app used for local searches on phones and tablets, at 35% and 25%, respectively.
Read MoreDevices Used By Stage Of Local Business Searches, December 2012 [CHART]
Where mobile phones and tablets really showed their specific utility was in the share of local searches that ended on the devices—18% for each, compared with 4% of PC searches.
Read MoreDevices Use For Multitainment, 2012 vs 2013 [CHART]
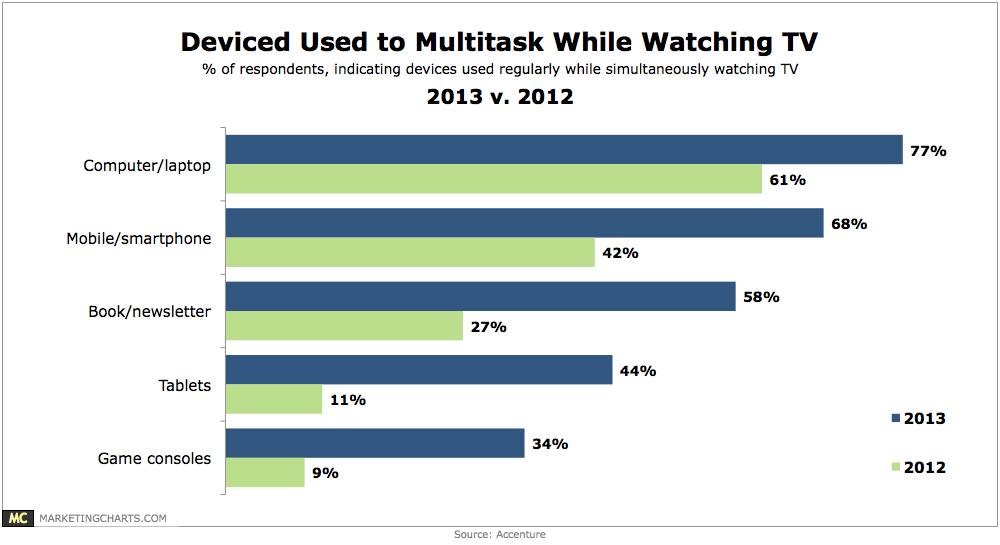
Regular use of tablets while watching TV (on a TV set) has soared from 11% in 2012 to 44% this year.
Read MoreMultiscreen Behavior With Facebook & Twitter By Gender, March 2013 [CHART]
Women were slightly more likely than men to turn to social media while watching TV, traveling and exercising, and significantly more likely to do so while shopping.
Read MoreMultiscreen Behavior With Facebook & Twitter, March 2013 [CHART]
More than eight in 10 Facebook users and about two-thirds of Twitter users used social networks while channel surfing.
Read MoreTime Spent On iOS & Android Devices By Activity, April 2013 [CHART]
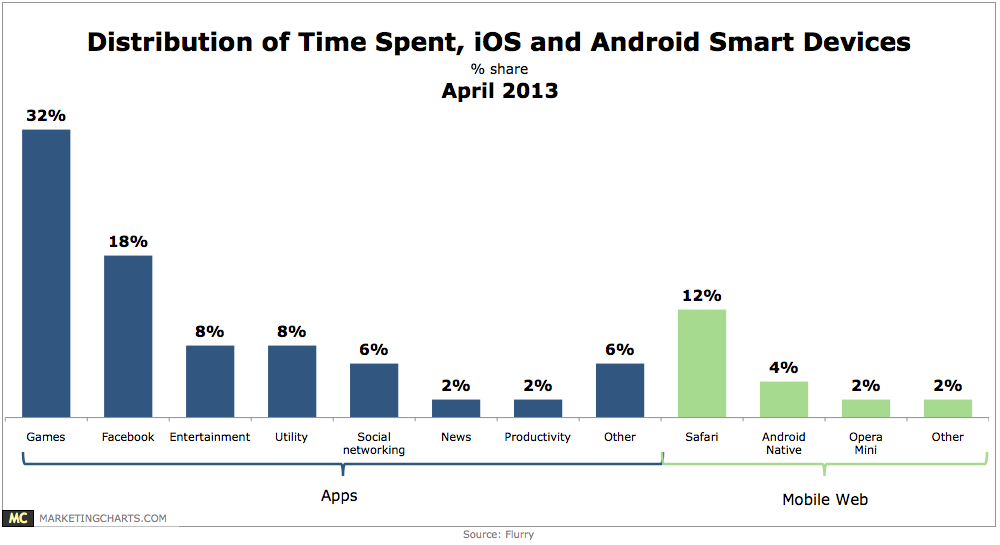
Android and iOS smart phone and tablet users spend an average of 2 hours and 38 minutes per day on their devices.
Read MoreSmart Phone Growth, October 2011 – February 2013 [CHART]
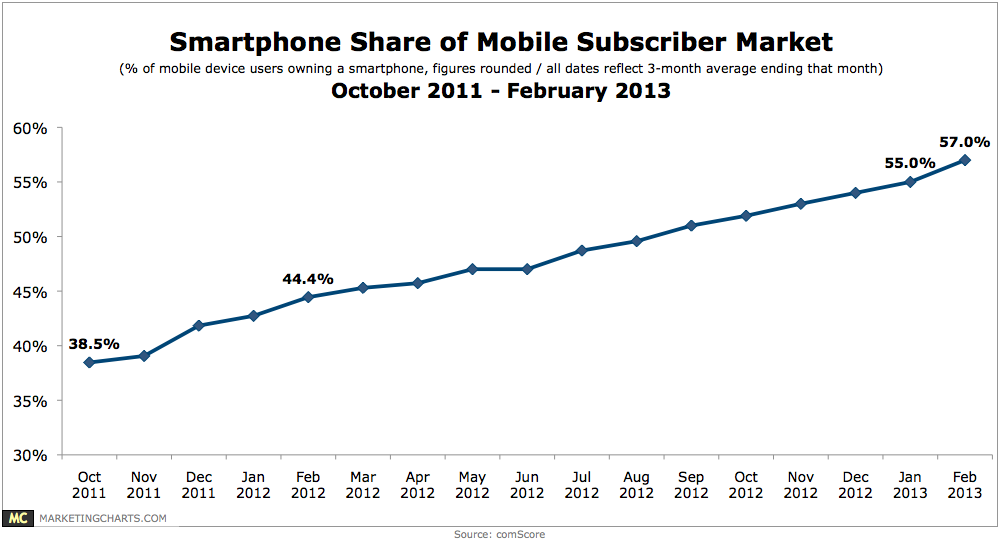
Smart phone penetration climbed to 57% of the US mobile market during the 3-month period ending in February 2013.
Read More