Technographics
Amount Of Mobile Shopping By American Moms, December 2012 [CHART]

Only 11% of moms said mobile was the shopping method they would choose, if given only one option.
Read MoreProduct Categories That Interest Mobile Moms, March 2013 [CHART]
Clothing and beauty ranked as the top product categories for which moms shopped on their smart phones and tablets, at 56% and 47%, respectively.
Read MoreMobile Connected Device Mix, Q1 2012 – Q1 2013 [CHART]
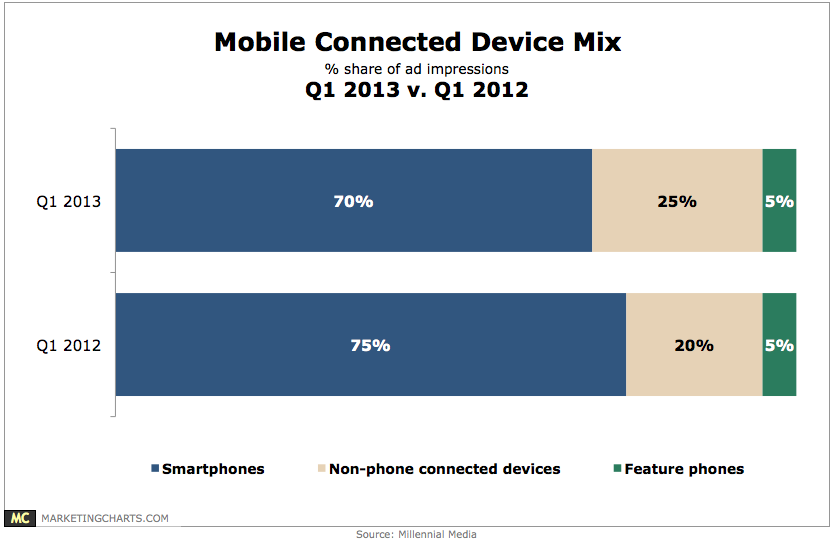
Non-phone connected devices accounted for 25% of total platform impressions, up from 20% a year earlier.
Read MoreSmart Device Users Worldwide By OS & Form Factor, February 2013 [CHART]
The vast majority of Android and iOS devices in use on the Flurry platform—and all Window devices—were medium phones.
Read MoreDigital Channels By Ability To Drive Store Traffic & Sales, May 2013 [CHART]
Nearly all retailers see their e-commerce sites as having a lot (58%) or some (38%) value in driving traffic to stores.
Read MoreAffluents' Shopping Habits, May 2013 [TABLE]
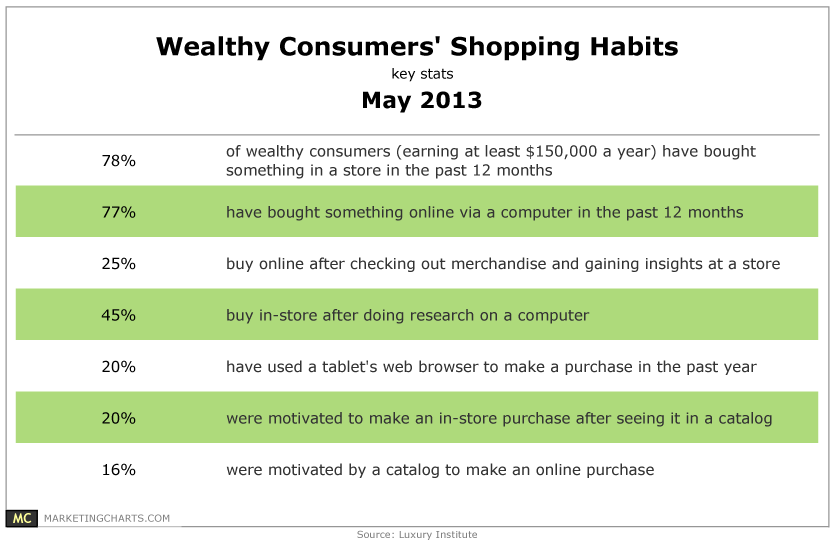
Wealthy consumers are as likely to make purchases in-store as online, and few have embraced showrooming, loosely defined as the practice of checking out a product in-store before buying online.
Read MorePercent Of Viewing Time Spent Using Tablets By Generation, May 2013 [CHART]
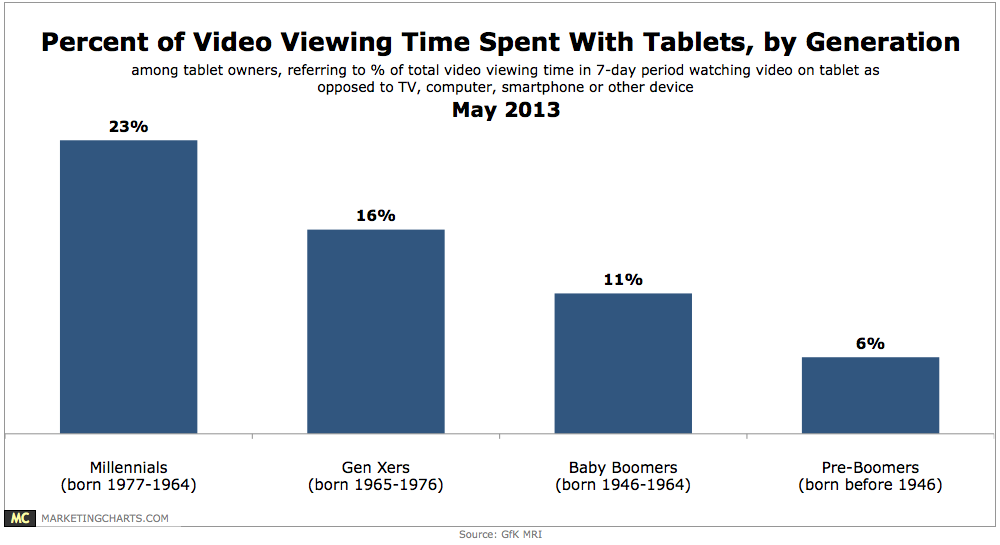
Among tablet owners, Millennials (born 1977-1994) spend on average 23% of their total video viewing time (time spent watching video on any device, including TV, in a 7-day period) with their devices.
Read MoreSmart Phone Shoppers' In-Store Product Research Resources, May 2013 [CHART]
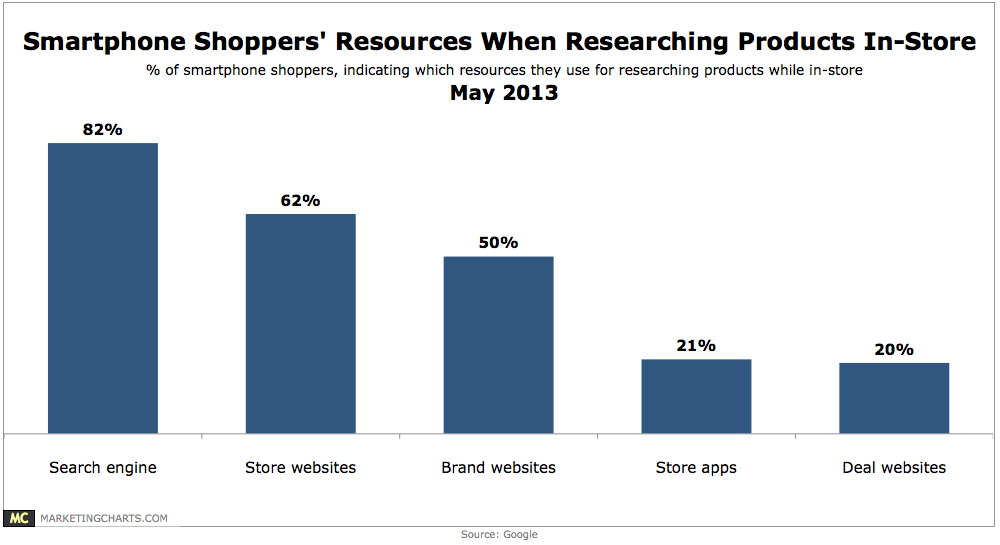
79% of smart phone owners qualify as smart phone shoppers.
Read MoreReasons For Mobile Shopping Cart Abandonment, May 2013 [CHART]

Roughly 7 in 10 smart phone and tablet owners have tried to make purchases on their device, indicating a high degree of comfort and enthusiasm with mobile commerce.
Read MoreAverage Monthly mCommerce Spending Among IYP Mobile App Users, December 2012 [CHART]
Forty-one percent of IYP app users had made a mobile purchase in December, compared with 19% of smart phone users.
Read More