Technographics
mCommerce Activities Of Affluent Americans By Device, April 2013 [TABLE]
Among US internet users ages 21 and older earning more than $150,000, more than eight in 10 owned a smart phone, while 56% reported owning a tablet.
Read MoreTime Americans Spend Watching Mobile TV By Device, January 2013 [CHART]
Only 2% of total TV viewership by American broadband subscribers who watched at least five hours of TV per week occurred on a tablet or smart phone.
Read MoreUS Mobile Shoppers Who Use Tablets, 2011-2017 [TABLE]
In 2011, there were 23.2 million US mobile shoppers using tablets.
Read MoreTelevision Viewing Places By Device, June 2013 [TABLE]
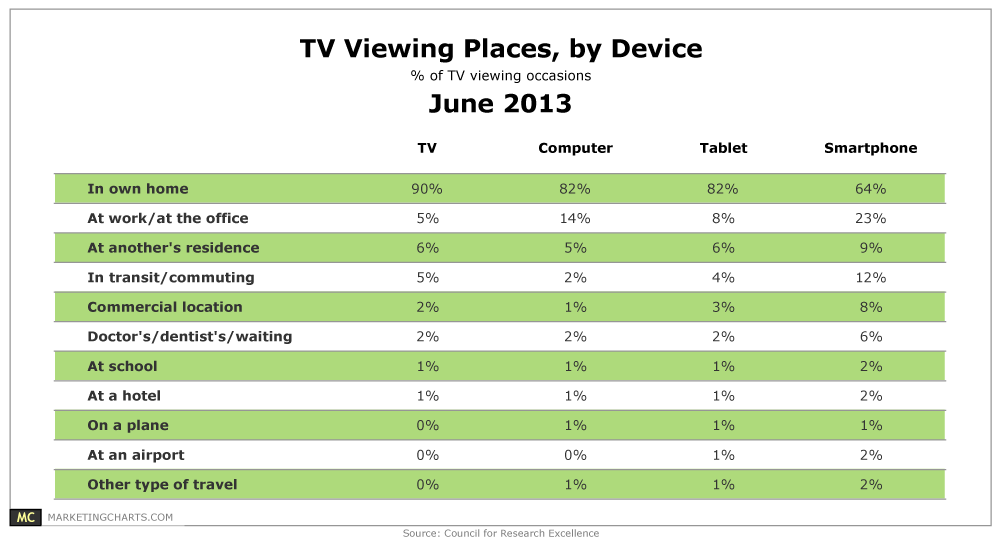
64% of smart phone TV viewing occasions occurred at home.
Read MoreSmart Phone Market Penetration, October 2011 – April 2013 [CHART]

During the 3-month period ending in April 2013, comScore says that the share of mobile subscribers with a smartphone was essentially flat from March, at 58%.
Read MoreTelevision Consumption By Device, June 2013 [CHART]
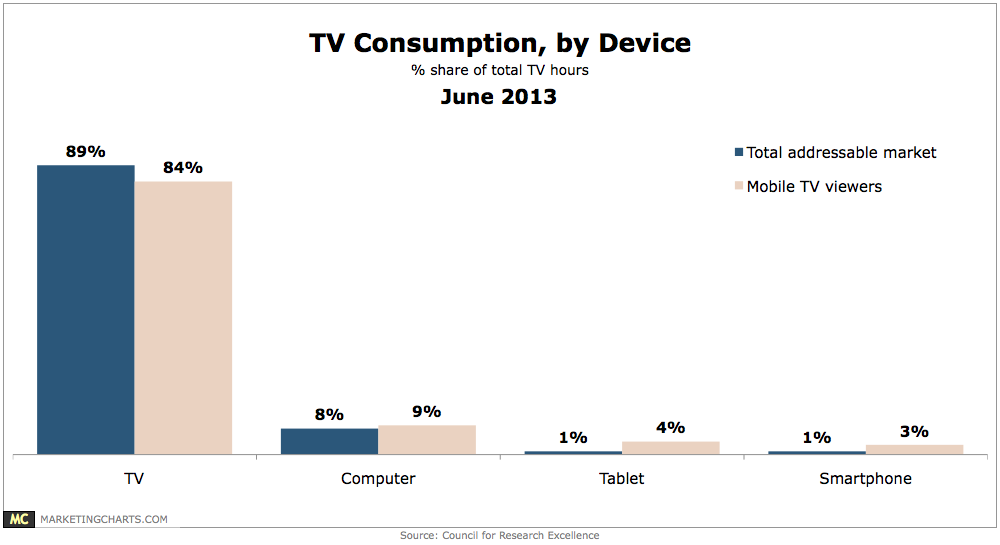
Just 2% of all TV hours logged were on tablets (1%) or smart phones (1%).
Read MoreSocial Media Sites Marketing Execs Use For Cross-Posting On Twitter, Q1 2013 [CHART]
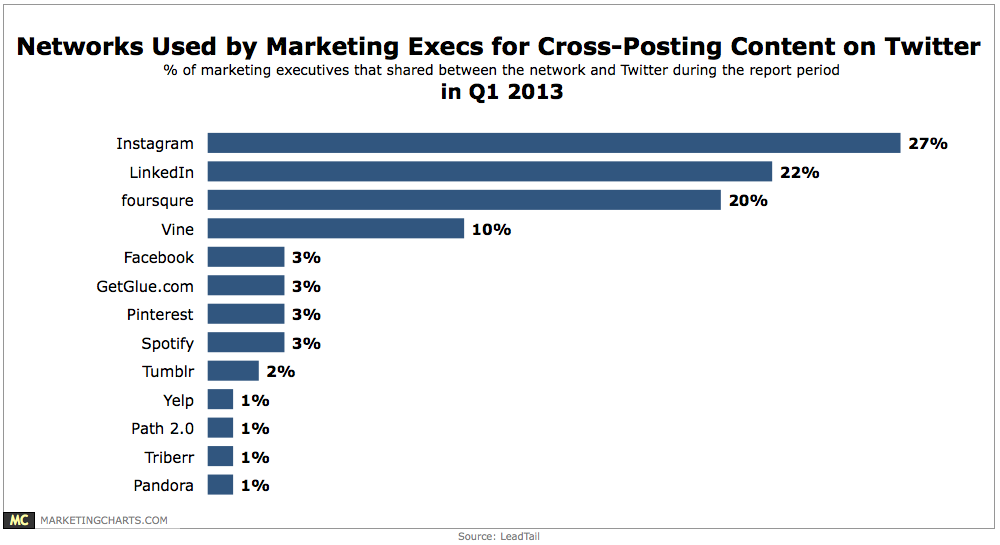
27% of marketing execs shared content between Instagram and Twitter, 22% shared content with LinkedIn, 20% with foursquare, and 10% with Vine.
Read MoreMobile Users' Internet Access Preferences, May 2013 [CHART]
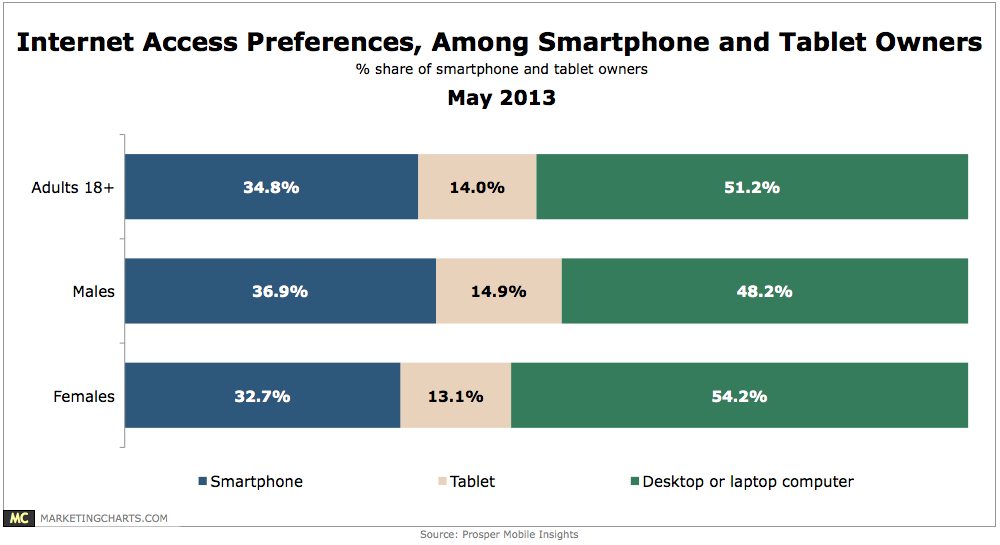
35% of mobile users prefer to access the internet via a smartphone and 14% via a tablet, meaning that only a bare majority still prefer to use their desktop or laptop computer.
Read MoreTop Mobile Devices By Ad Performance, Q1 2013 [TABLE]
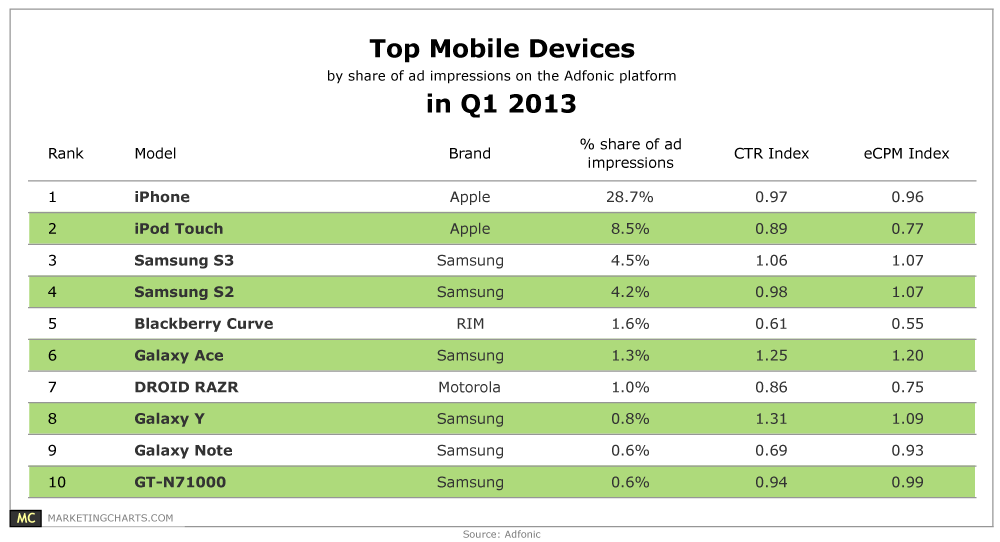
Samsung mobile devices on the whole sported higher click-through rates than the iPhone in the US and UK during Q1.
Read MoreDevices Used To Visit Social Media Sites By Gender, March 2013 [CHART]
The desktop and laptop remained the No. 1 place where users accessed sites, but the smart phone wasn’t far behind.
Read More