Technographics
US Device Ownership Trend, 2011-2013 [CHART]
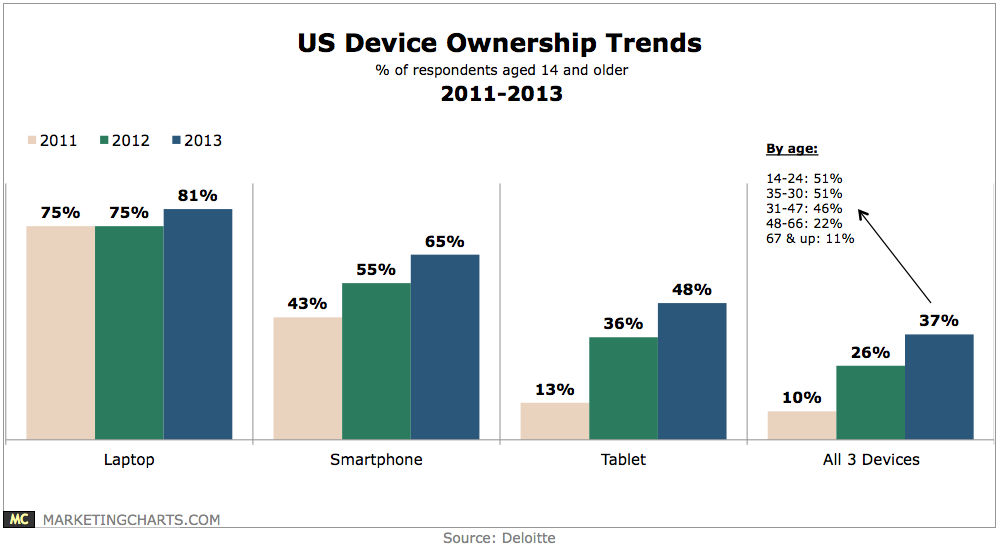
37% of Americans aged 14 and older own a trio of devices – laptop, smartphone and tablet – as of late 2013, up from 26% in late 2012 and 10% the year before.
Read MorePreferred News App Content, Smart Phone vs Tablet, December 2013 [CHART]
Getting breaking news via smartphone apps was far more popular than on tablets, likely due to the former being more portable.
Read MoreLong-Form Video Share Of Time Watched By Device, Q4 2013 [CHART]
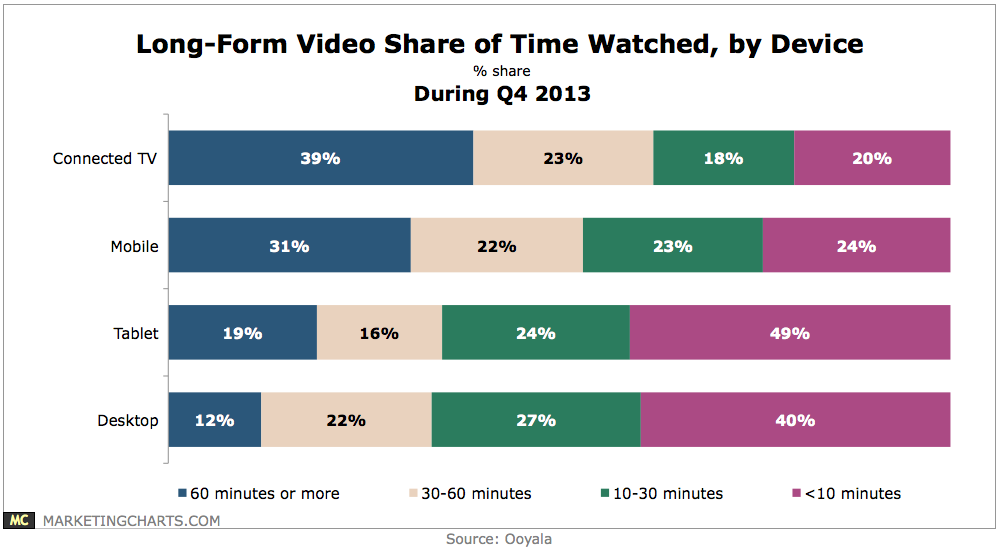
The majority of mobile video viewing time in Q4 2013 was spent with content at least a half-hour in length.
Read MoreUS Mobile Banking Demographics, March 2014 [CHART]
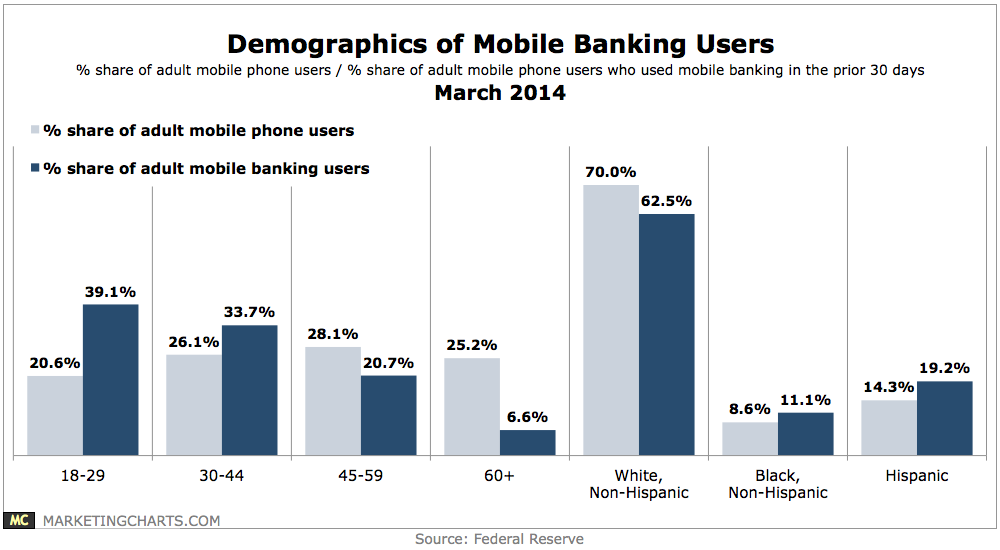
33% of mobile phone owners had used mobile banking during the 30 days prior to the survey, up from 28% a year earlier.
Read MoreThe Student Marketing Lifecycle [INFOGRAPHIC]
This infographic by Oho illustrates the stages of research a prospective student goes through when deciding which college to attend.
Read MoreFrench Tablet Users, 2012-2017 [TABLE]
The number of tablet users in France rose less rapidly than the shipments tracked by IDC—yet still climbed by roughly 40%.
Read MoreMost Important Areas Of Online Marketing Focus, 2012-2014 [CHART]
In 2012, big data wasn’t even in the picture. By 2013, the first year the response was an option, more than one-third of marketers chose it.
Read MoreMost Common Purchases On Mobile Phones, Tablets & PCs, March 2014 [TABLE]
The vast majority of mobile phone and tablet owners have purchased products and services on their devices.
Read MoreWeekly Time Spent With Various Devices, March 2014 [CHART]
In terms of individual activities, TV is the clear-cut winner: US adults spend more than 27 hours a week watching TV.
Read MoreDevices Spaniards Use To Go Online, December 2013 [CHART]
68.9% said they had used the internet for more than 10 years, and 84.4% said they accessed the web several times each day.
Read More