Technographics
Tablet Commerce Metrics By Day Of The Week, Q1 2014 [CHART]
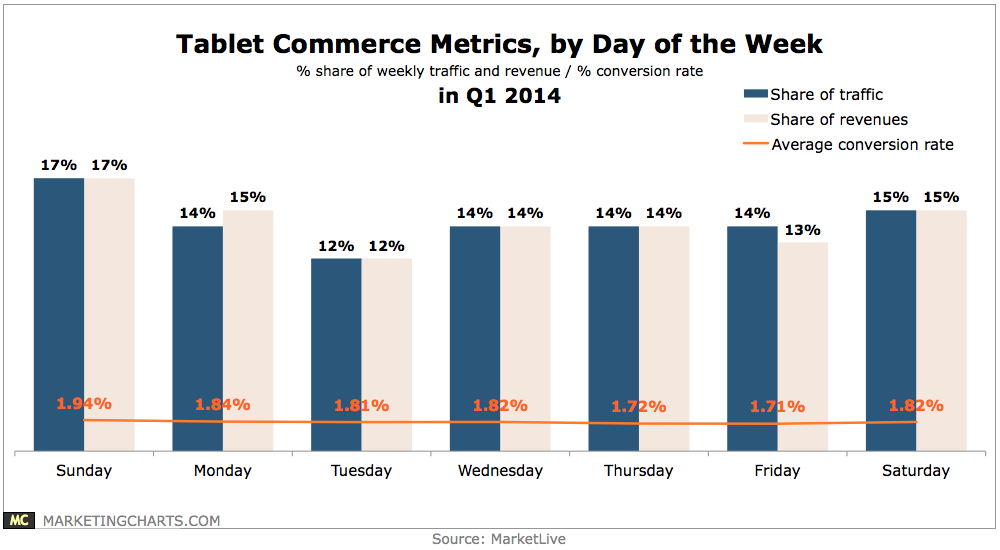
Mobile accounted for 10.5% of retail e-commerce spending last year.
Read MoreUS Connected Device Penetration, 2013 vs 2014 [CHART]
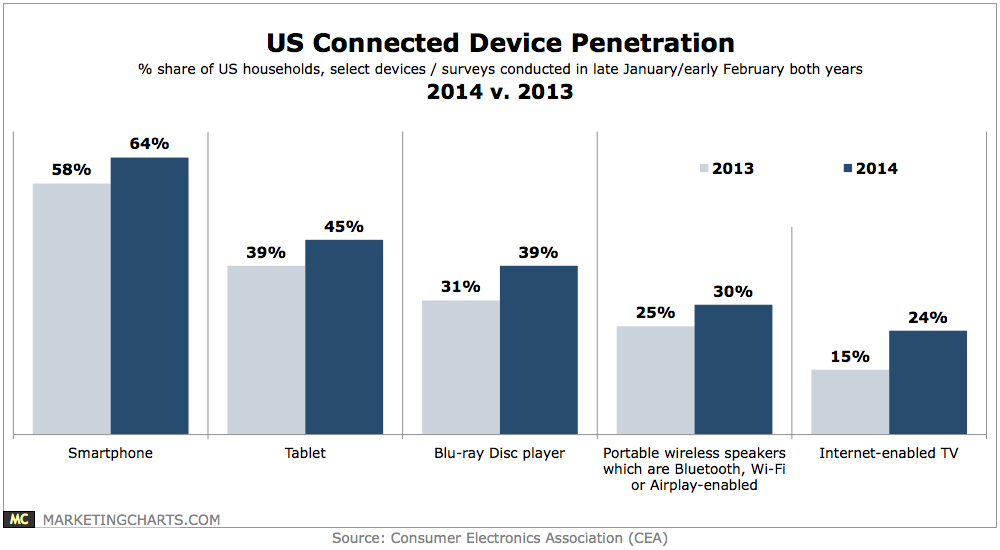
Some 45% of households own a tablet as of late January, up 6% points from the comparable period last year, and 16% plan to purchase one this year.
Read MoreUS Smartphone Penetration, October 2011 – March 2014 [CHART]
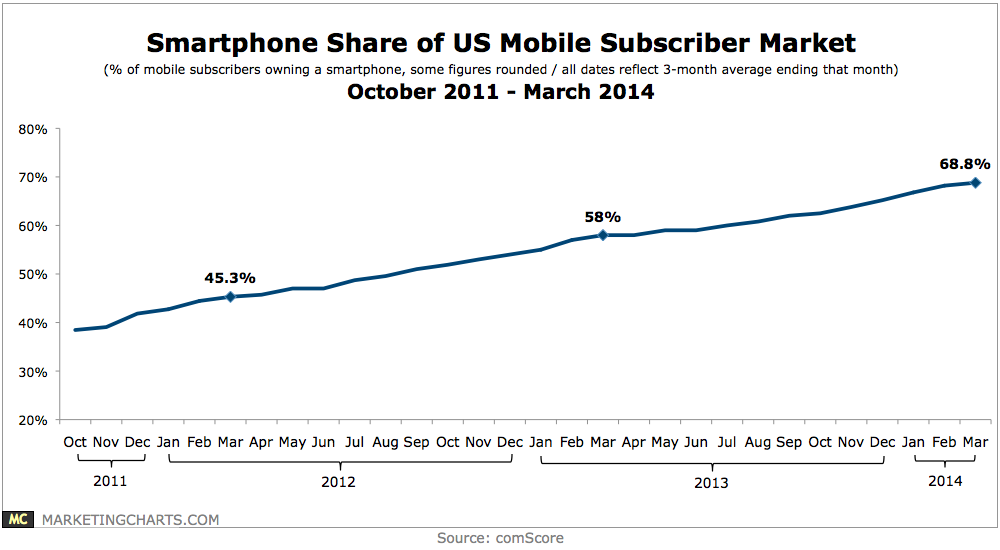
Smartphone penetration reached 68.8% of the US mobile market during Q1, up from 65.2% in Q4 2013 and 58% in Q1 2013.
Read MoreUK Online Video Viewing Share By Device, Q3 2012-Q3 2013 [TABLE]
Smart phones were accounting for a growing proportion of digital video viewing among the general UK population—up from 17% in Q3 2012 to 23% in Q3 2013.
Read MoreAmericans Who Abandoned An In-Store Purchase As A Result Of Mobile Use, January 2014 [CHART]

Nearly two-thirds of Gen Xers and Yers said they had decided not to make an in-store purchase based on information they found via smartphone.
Read MoreAmericans Who Use Their Smart Phones In-Store By Generation, January 2014 [CHART]

The majority of US smartphone users in each age demographic studied used their phones at least sometimes while shopping in brick-and-mortar stores—and few felt guilty about it.
Read MoreUS Mobile Video Viewer Metrics, 2012-2018 [TABLE]
Nearly half of the US population will use a tablet at least monthly in 2014.
Read MoreUK Tablet Users, 2012-2018 [TABLE]
Driven by the popularity of the iPad, UK tablet usage saw explosive growth over the past few years.
Read MoreUK iPad Users, 2012-2018 [TABLE]
This year, for the first time ever, most people in the UK who use a tablet won’t be using an iPad.
Read MoreAverage Daily Time Spent On Social Networks By Device, 2014 [CHART]
Social network usage among US adults has made the switch to majority-mobile this year.
Read More