Technographics
Mobile Podcast Listeners By Age, September 2015 [CHART]
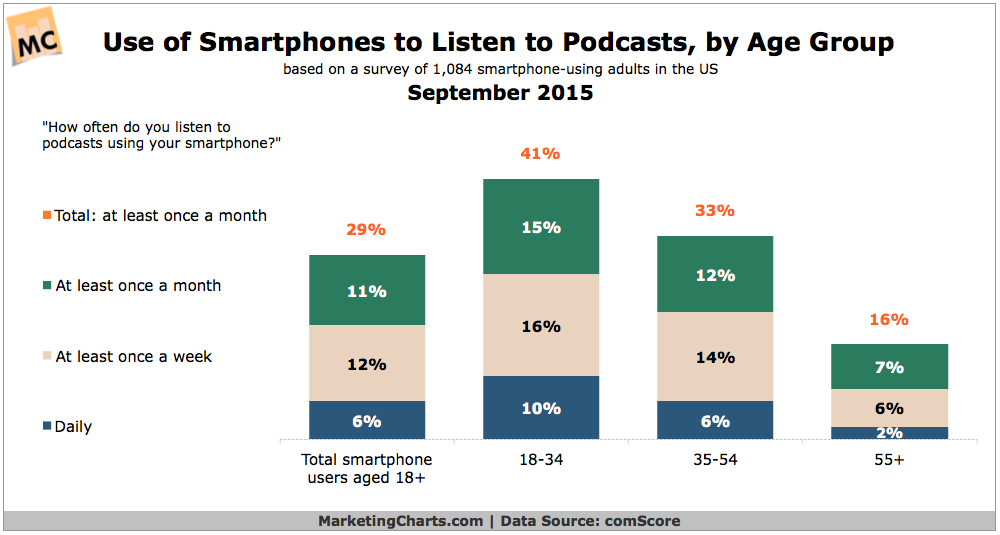
Some 29% of smartphone-owning adults listen to podcasts using their smartphones at least once a month.
Read MoreSmart Phone Activities By Generation, July 2015 [CHART]
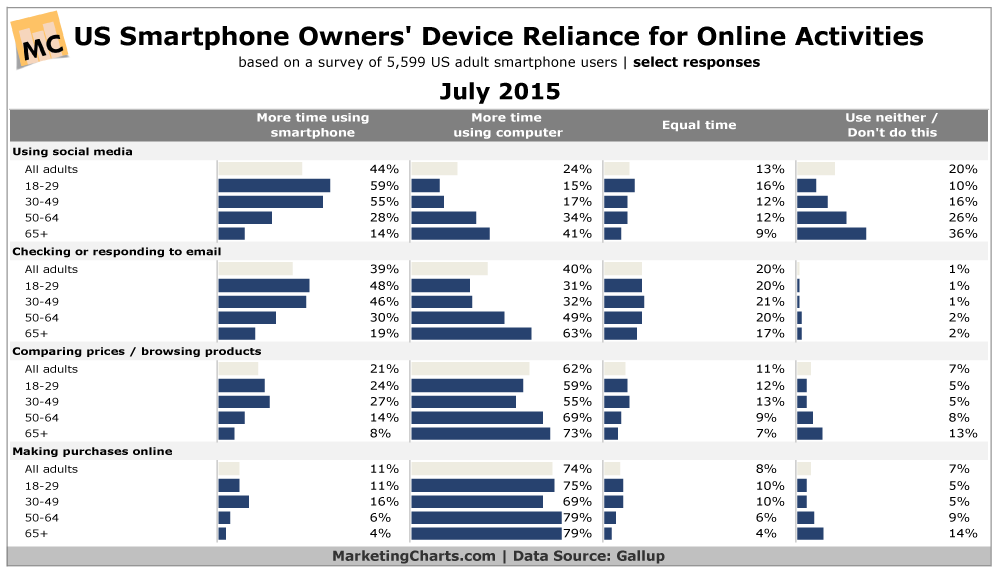
The only activity of those identified for which smartphones are the primary device is social media use.
Read MoreFrequency Of Smart Phone Use By Demographic, July 2015 [CHART]
Roughly half of US smartphone owners say they check their phone a few times an hour or every few minutes .
Read MoreUS eCommerce Metrics by Device, Q1 2015 [CHART]
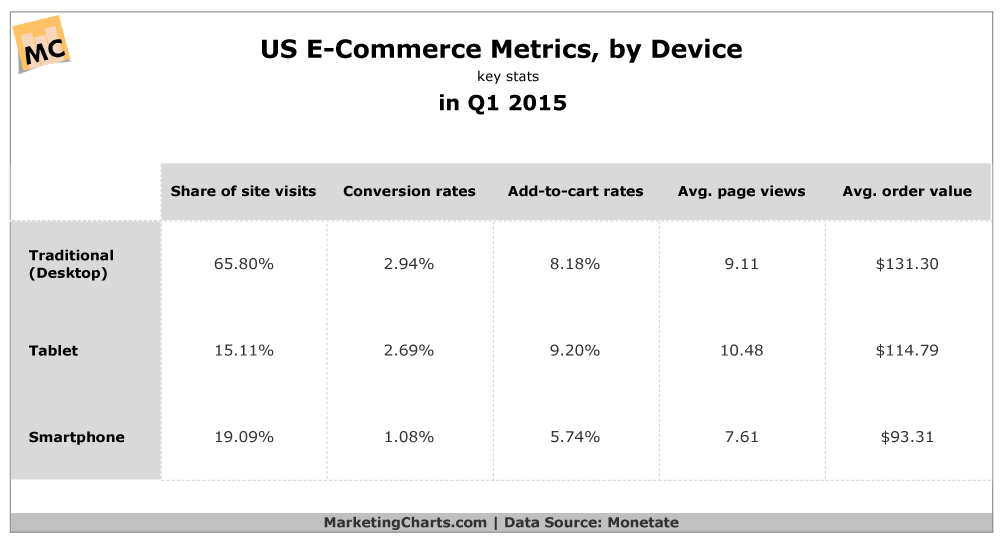
Smartphones have grown to represent almost 1 in 5 visits to US eCommerce retailers.
Read MoreDevices Mothers Use To Check Facebook, 2012-2015 [CHART]
In 2015, 67% of mother Facebook users logged on to the social network via mobile phone, up from 60% in 2014 and just 45% in 2013.
Read MoreVideo Game Devices Frequent Gamers Use, February 2015 [CHART]
PCs were the most popular game-playing devices, used in 62% of gamer households.
Read MoreDemographics Of Video Gamers, February 2015 [CHART]
Four out of five US households owned a device used for video gaming, and there was an average of two gamers in each game-playing household.
Read MoreUS Smartphone Penetration By Age Group, 2014-2015 [CHART]
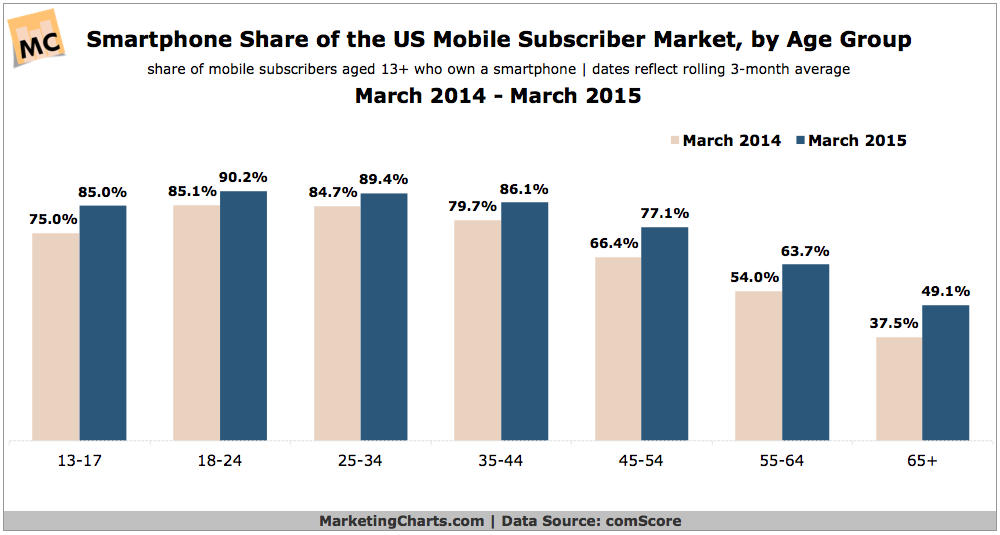
US Smartphone penetration reached 77% of the US mobile subscriber market (13+) during Q1 2015.
Read MorePrimary Podcast Listening Device, 2014 vs 2015 [CHART]
Fully 55% of US consumers ages 12 and older who had ever listened to a podcast said they used a smartphone, tablet or portable audio player most frequently to do so.
Read MoreMulti-Device Internet Access By Age Group, 2014 vs 2013 [CHART]
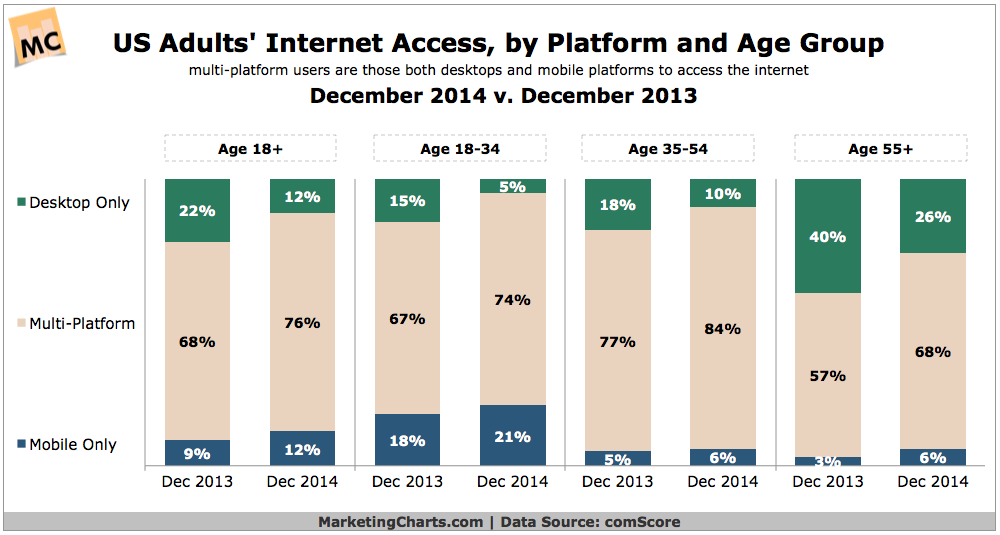
Some 21% of online US adults aged 18-34 accessed the internet using only mobile devices in December 2014, up from 18% doing so last year.
Read More