Social Television
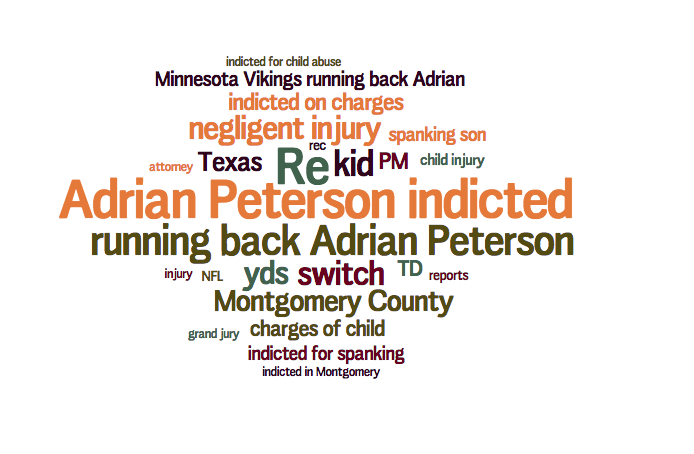
Super Bowl XLVII-Related Searches During The Game [CHART]
This chart shows trending searches that were performed during the broadcast of Super Bowl XLVII.
Read MoreSocial TV & Super Bowl XLVII [INFOGRAPHIC]
This infographic by Trendrr TV breaks down the social TV chatter that Super Bowl XLVII generated.
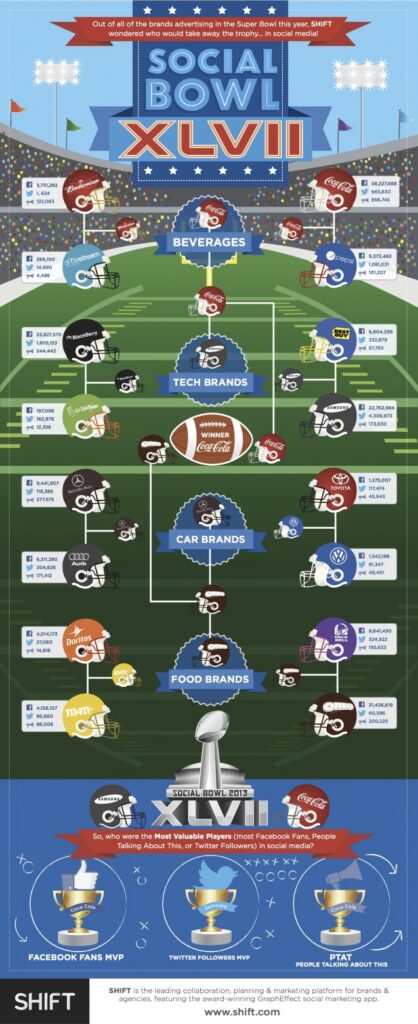
Read MoreSocial Super Bowl XLVII [INFOGRAPHIC]
This infographic pits some major brands that advertised during Super Bowl XLVII against one another based on social media presence.
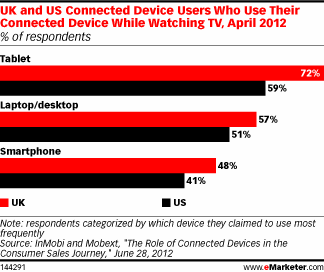
Read MoreMultitainment Behavior In The US & UK, April 2012 [CHART]
As tablet and mini tablet uptake rises, the devices are becoming the primary companion screen alongside the television.
Read MoreOnline Channels That Prompt Television Viewership By Generation, September 2012 [CHART]
Facebook had the greatest influence on getting people to watch a show—46% said they picked up a show as a result of the social network.
Read MoreThe Year In Social Media, 2012 [INFOGRAPHIC]
This infographic documents the social media highlights of 2012.
Read MoreMost Socially-Engaging TV Genres, January-November 2012 [CHART]
Sports (31%) and reality (17%) are the primary genres generating social TV buzz, combining to account for about half of social TV conversations.
Read MoreAmerican Social TV Activity, Q2 2011 & Q2 2012 [CHART]
In June 2012 there were more than 81M conversations about TV on Twitter, Facebook and a host of other social media properties, including GetGlue, Miso & Viggle.
Read MoreHow Americans Followed The 2012 Olympics Coverage [CHART]
The Olympics showed that consumers were willing to engage with social media before, during and after a broadcast.
Read More