Social Television
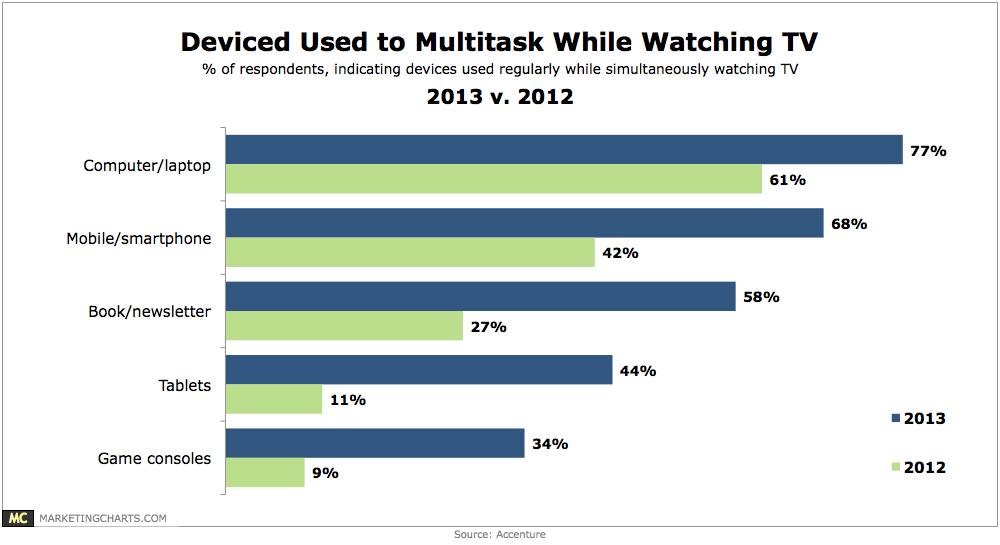
Devices Use For Multitainment, 2012 vs 2013 [CHART]
Regular use of tablets while watching TV (on a TV set) has soared from 11% in 2012 to 44% this year.
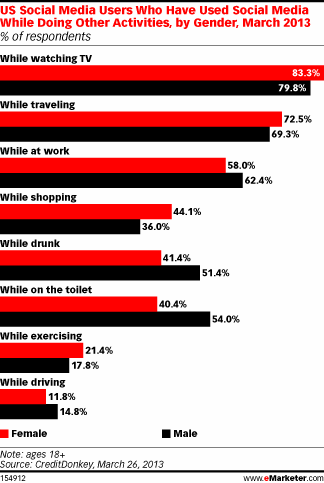
Read MoreMultiscreen Behavior With Facebook & Twitter By Gender, March 2013 [CHART]
Women were slightly more likely than men to turn to social media while watching TV, traveling and exercising, and significantly more likely to do so while shopping.
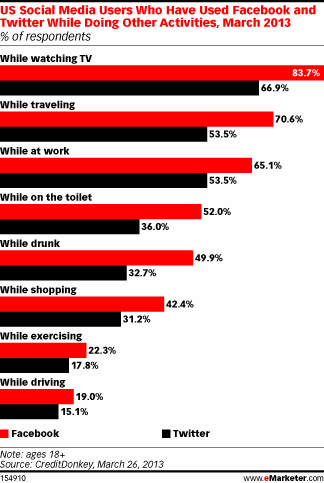
Read MoreMultiscreen Behavior With Facebook & Twitter, March 2013 [CHART]
More than eight in 10 Facebook users and about two-thirds of Twitter users used social networks while channel surfing.
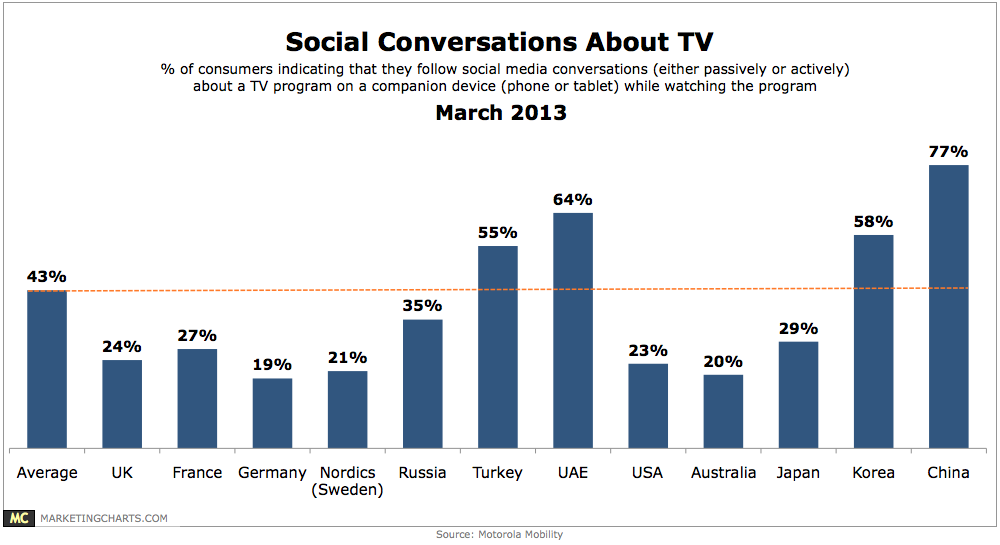
Read MoreSocial TV Activity By Country, March 2013 [CHART]
Across 12 countries examined, an average of 43% of respondents reported following social media conversations about a TV program on a companion mobile device while watching the program.
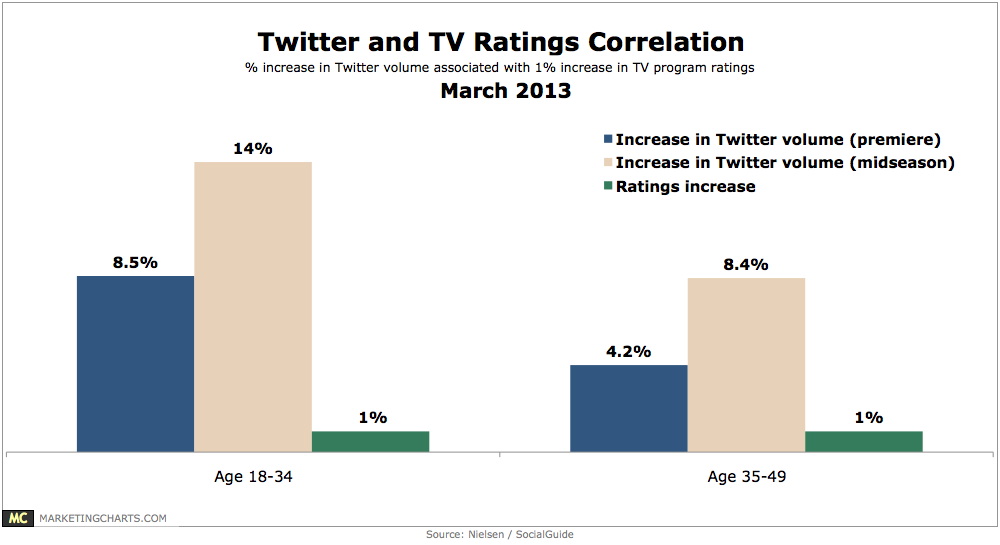
Read MoreTwitter Buzz & TV Ratings, March 2013 [CHART]
For 18-34-year-olds, an 8.5% rise in Twitter volume corresponds with a 1% increase in TV ratings for premiere episodes.
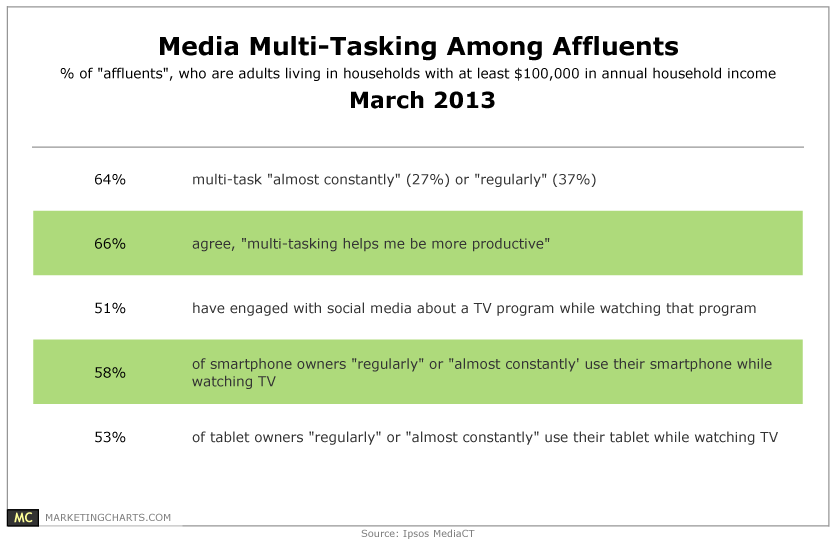
Read MoreAffluents' Multi-Screen Behavior, March 2013 [TABLE]
51% of affluents have engaged with social media about a TV program while watching that program.
Read MoreOscars 2013 Social TV Chatter On Facebook [INFOGRAPHIC]
This infographic by Facebook illustrates some of the Social Television chatter that occurred during the Oscars broadcast.
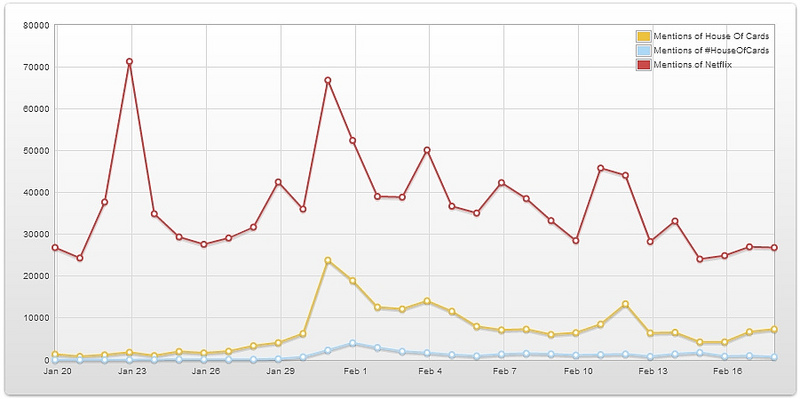
Read MoreHouse Of Cards Twitter Chatter [CHART]
Not surprisingly, the use of a #HouseOfCards hashtag is very low, considering Netflix has never promoted its use.
Read MoreMost Exciting Online Opportunities, 2012 vs 2013 [TABLE]
35% of respondents thought social media presented one of the most exciting digital opportunities in 2013, a significant drop from the 54% who said the same in 2012.
Read More