Social Television
American Females' Brand Interaction Via Social Television, February 2014 [CHART]
Facebook and Twitter were the social networks female internet users were most likely to use during the Academy Awards, cited by 82.15% and 61.23% of respondents, respectively.
Read MoreWhy American Women Engage With Social Television, February 2014 [CHART]
97% said they would use social media while viewing the Oscars.
Read MoreDaily Mobile Activities, February 2014 [CHART]
Smart phone owners spend a whopping 3.3 hours per day on their phones, while tablet owners are close behind, averaging 3.1 hours a day on their devices.
Read MoreOnline Activities Performed By TV Viewers, November 2013 [TABLE]
Searching the internet for information was the most common activity conducted while watching TV.
Read MoreMultitainment Devices, November 2013 [CHART]
Three-quarters of US TV viewers were more focused on what was on the tube, even when using a second screen.
Read MoreUSA Today 2014 Super Bowl Ad Ratings [INFOGRAPHIC]
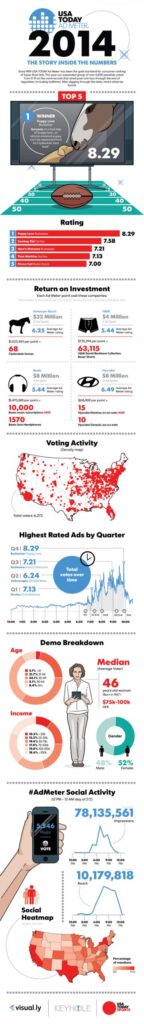
This infographic by USA Today illustrates the top commercials for the 2014 Super Bowl and their return on investment.
Read MoreSocial TV & Super Bowl Ads [INFOGRAPHIC]
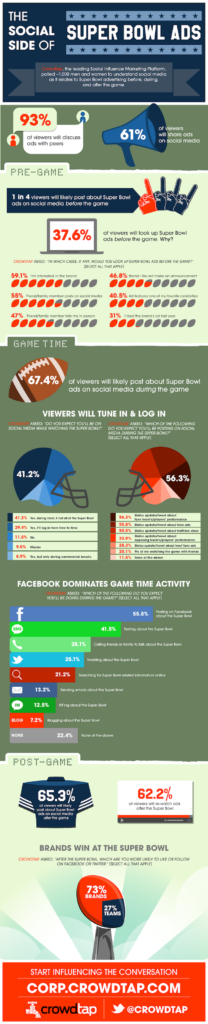
This infographic from Crowdtap illustrates the social side of Super Bowl ads.
Read MoreTV Viewers & Multitasking, January 2014 [VIDEO]

New survey data from TiVo suggests that viewers themselves believe they’re primarily paying attention to the box.
Read MoreOverlap Between TV & Brand Tweeters, January 2014 [CHART]
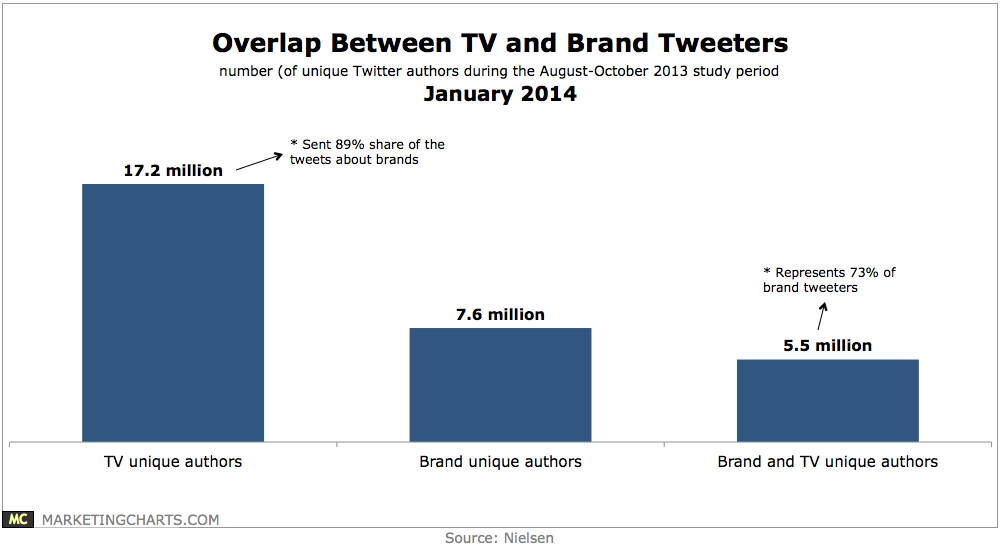
TV tweeters make up 73% of the number of people who tweeted about brands during the study period.
Read MoreSocial TV Behavior, Q1-Q3 2013 [CHART]
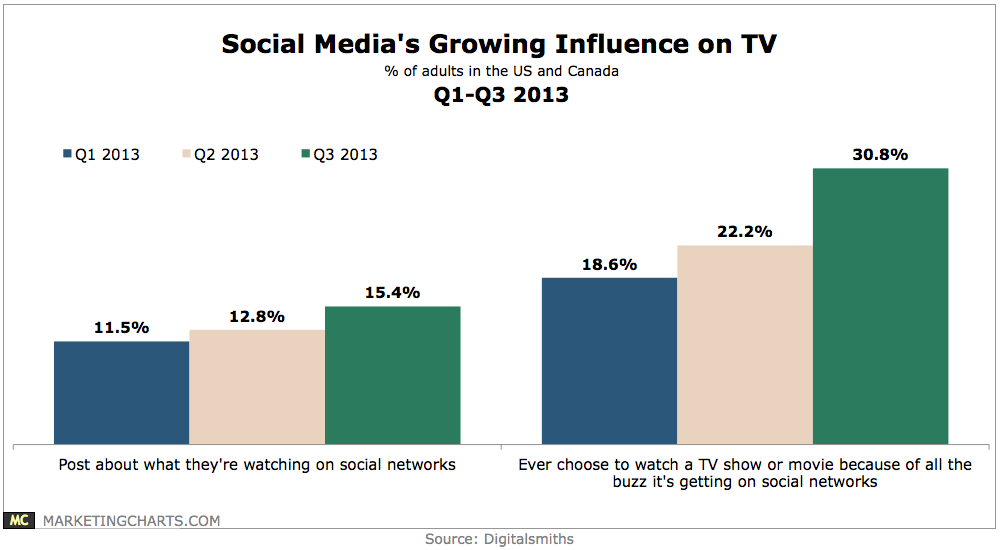
During Q3, 15.4% of adult respondents in the US and Canada claimed to post about what they’re watching, up from 12.8% in Q2 and 11.5% in Q1.
Read More