Social Television
Social TV Penetration [INFOGRAPHIC]
Large majorities approaching 90% now use their mobile devices while watching conventional television.
Read MoreTop 10 TV Programs & Events By Social Chatter [TABLE]
The number of social conversations about TV on several leading social sites rose from just over 10 million in June 2011 to over 81 million by June 2012.
Read MoreSocial Media TV Chatter, January – June 2012 [CHART]
In June alone, Trendrr tracked more than 81 million social-TV conversations and interactions. That’s an all-time high, a 15% increase from May 2012 and a 681% increase from June 2011.
Read MoreMike's Hard Lemonade Commercial Social Media Chatter [INFOGRAPHIC]
Bluefin examined a pre-campaign period–when Mike’s Hard Lemonade spots weren’t running–and then an in-flight period when the campaign was in full swing.
Read MoreSocial TV Ecosystem [INFOGRAPHIC]
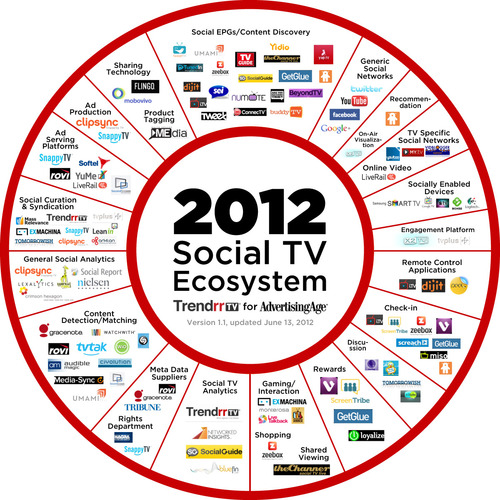
via adage.com
Read More