Social Media Marketing
Primary Content Sharing Channel By Device, Q4 2014 [CHART]
Facebook accounted for 85% of mobile sharing activity among US internet users in Q4 2014, according to ShareThis, up 51% year over year.
Read MoreGrowth In Content Sharing Channels, Q4 2014 [CHART]
Despite rumors popping up every so often that some people may be cutting back on Facebook usage, the social network reigns supreme.
Read MorePrimary B2B & B2C Revenue-Driving Channels, February 2015 [CHART]
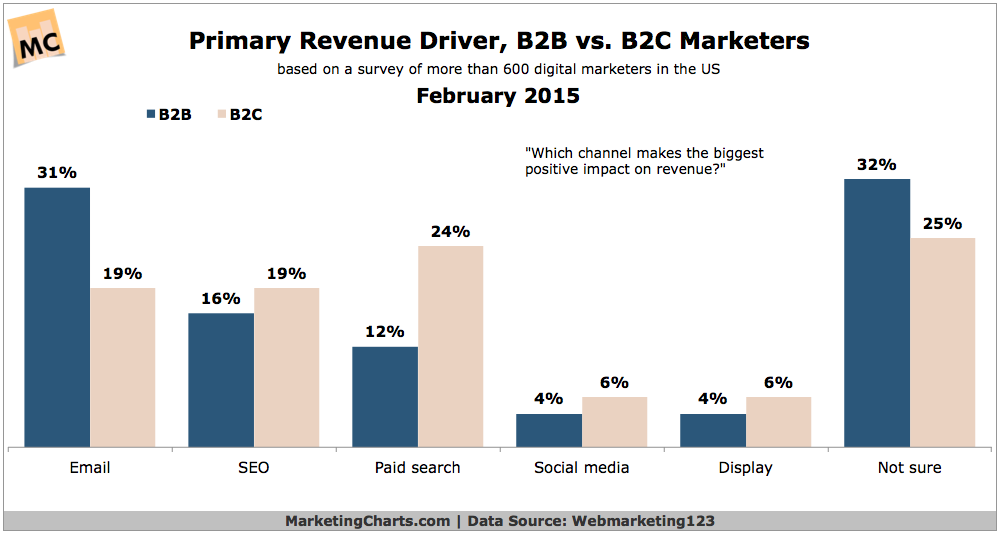
B2B marketers count lead generation as their top marketing objective, while B2C marketers are most heavily focused on driving sales this year.
Read MoreB2B Opportunity-To-Deal Conversion Rates By Channel, October 2014 [CHART]
Customer and employee referrals ruled when it came to this part of the pipeline, as 14.7% of referral leads that converted to opportunities resulted in a sale.
Read MoreB2B Lead Conversion Rates By Channel, October 2014 [CHART]
3.63% of B2B leads generated from customer and employee referrals resulted in a sale.
Read MoreTwitter Firehose In Google Search [VIDEO]

The Twitter Firehose in Google search may provide an amazing consumer insight tool to understand how people behave on social media.
Read MoreMobile Millennials Expectations For Brands Technology Use, February 2015 [CHART]

Mobile Millennials are more likely to expect brands to have a mobile-friendly website or app than they are to expect brands to have a social media presence.
Read MoreAmount Millennials Spend Via Social Commerce, Fall 2014 [CHART]
Nearly three-quarters of Millennials spent $49 or less when buying something via Twitter, compared with 54% who said the same about Facebook.
Read MoreWhy Millennials Follow Brands On Facebook, Twitter or Pinterest, Fall 2014 [TABLE]
US Millennials were most likely to follow a brand or company on Twitter to get a coupon or discount, cited by 85%.
Read MoreMost Socially-Shared Content By Type [INFOGRAPHIC]
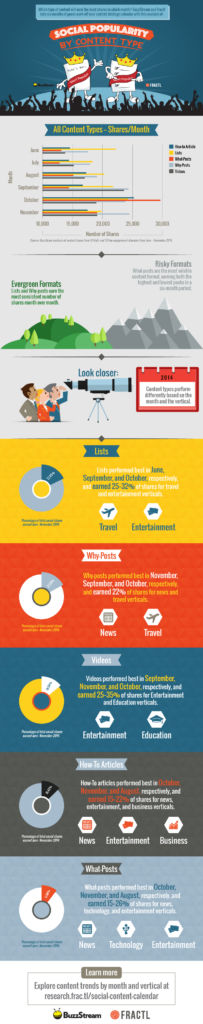
This infographic by looks at the most popular types of content shared on social media based on sharing data from 220,000 articles from 11 vertical industries.
Read More