Social Media Marketing
The History of Online Advertising [INFOGRAPHIC]
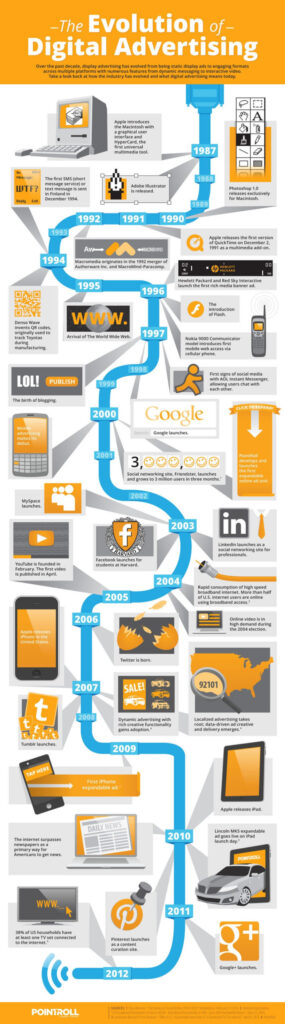
This infograph by PointRoll illustrates the history of online advertising.
Read MoreMost Popular Smart Watch Apps By Gender, October 2014 [TABLE]
Most Popular Smart Watch Apps By Gender: Women liked social networking apps the best while men liked sports and gaming apps best.
Read MorePsychology Of Social Commerce [INFOGRAPHIC]
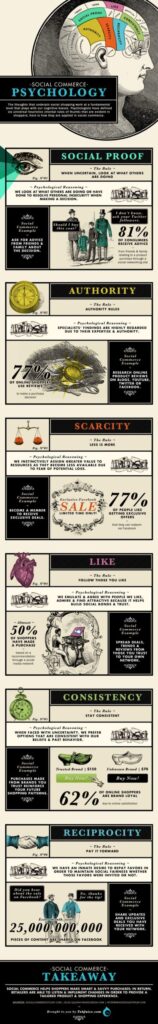
This infographic illustrates six dynamics of the psychology of social commerce.
Read MoreSocial Authority Affects Google's Tweet Indexation [CHART]
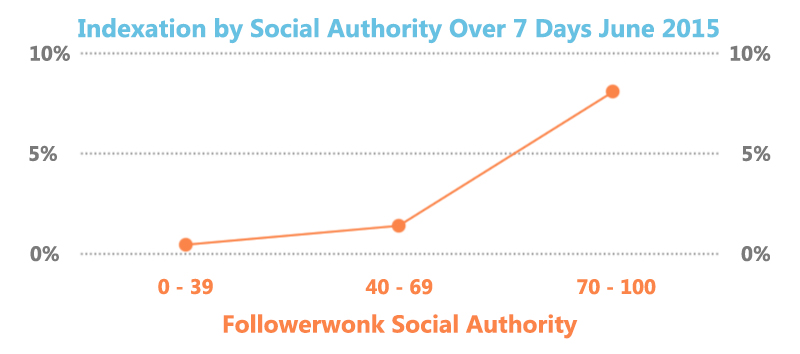
Google is looking at more than simple follower count to pick out what tweets they want to index.
Read More466% Increase In Google Tweet Indexing [CHART]
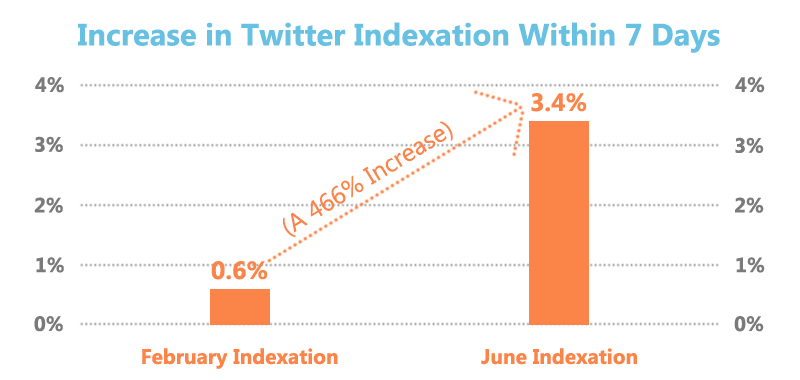
Indexation of tweets in the first 7 days increased from about 0.6% in February to 3.4% in June. That’s a whopping 466% increase, but still leaves more than 96% of Tweets out of Google’s index.
Read MoreTop Social Video Ad Metrics, December 2014 [CHART]
Mixpo noted that respondents were looking for more than just a social video view or time spent with an ad; they wanted users to take additional steps after seeing the placements.
Read MoreSocial Sites That Ad Execs Have Used vs. Plan To Use For Video, December 2014 [TABLE]
Nearly nine in 10 US advertising executives polled said they planned to run a video ad campaign on Facebook in the coming year—the highest response rate out of all networks.
Read MoreTop Audience Targeting Types For Branding, May 2015 [CHART]
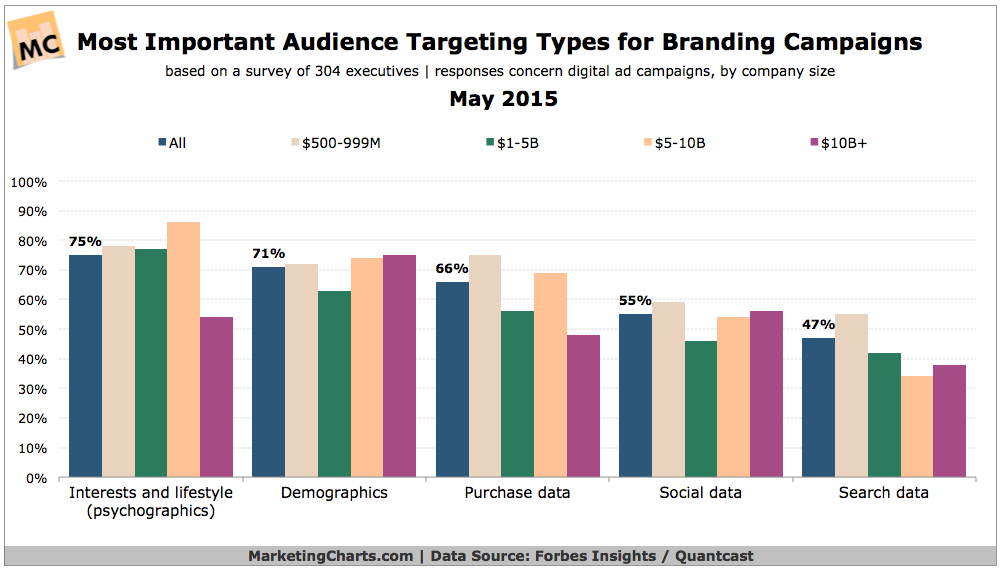
Psychographics (such as interests and lifestyle) and demographics are the most important types of audience targeting for digital branding campaigns.
Read MoreSocial TV Engagement Rates By Show Type, May 2015 [CHART]
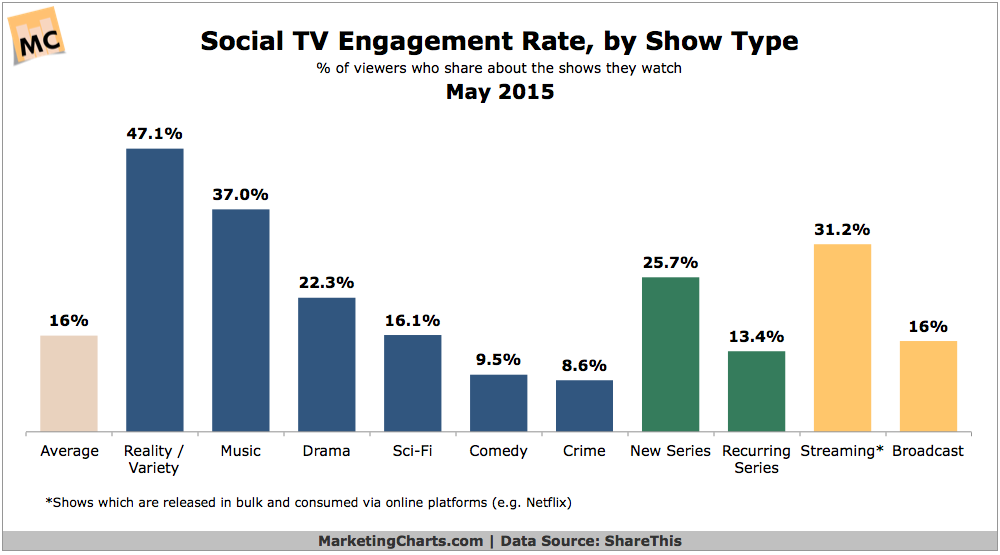
Some 16% of TV viewers on average share content about the shows they’re watching online, with these viewers driving an impressive 11% of all online sharing.
Read MoreFacebook Exchange CTRs vs Facebook Custom Audiences CTRs, January-December 2014 [CHART]
In December 2014, the average CTR for US retargeted display ads run on WCA was 1.25%, vs. just 0.12% for FBX.
Read More