Social Media Marketing
Daily Time Spent On Facebook By Device, 2013-2018 [CHART]
This year, Americans will spend more than half of their social networking time on Facebook.
Read MoreMost Important Factors For B2B Marketers' Future Efforts [CHART]
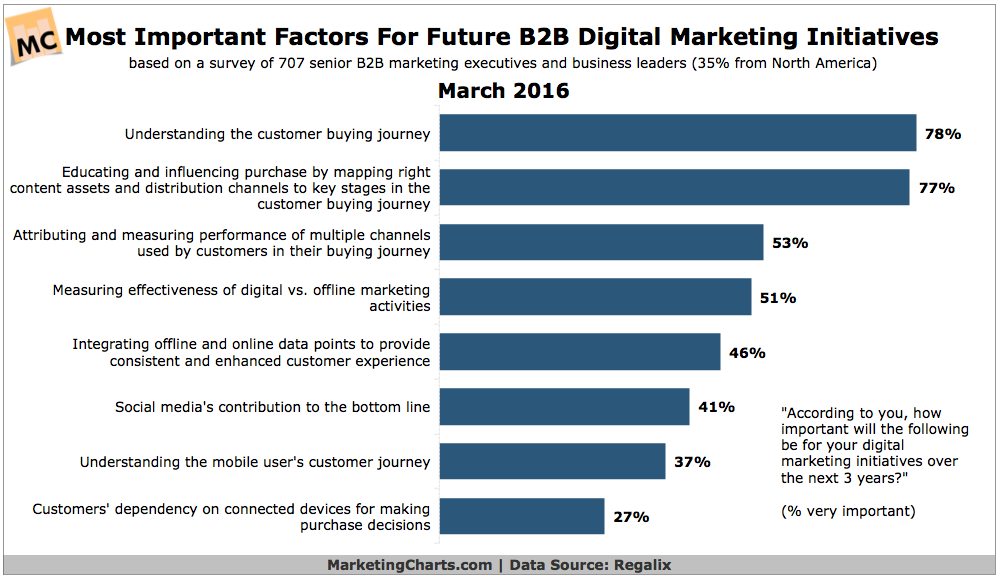
While the delivery of quality leads is marketers’ top objective, measuring and proving ROI is the biggest digital marketing challenge.
Read MoreBudget Allocations For Medical Marketing [CHART]

Professionals meetings and conferences occupy the largest share (13.7%) of medical marketing budgets.
Read MorePerfect Social Media Posts [INFOGRAPHIC]

This infographic from Quick Sprout illustrates some of the elements that go into creating create posts for YouTube, Facebook, Twitter, Pinterest, and Google+.
Read MoreConsumers' In-Store Mobile Activities [CHART]

Mobile devices and other digital technologies continue to have a growing impact on retail, including in-store shopping.
Read MoreSnapchat Growth Among Millennials & Gen Xers [CHART]

Snapchat is getting more popular with older demographics, particularly the 25-34 and 35-44 age groups.
Read MoreUS Political Ad Spending By Format, 2008-2016 [TABLE]
While TV is still the dominant destination for political ad spend, spending on digital channels, is increasing the fastest year over year.
Read More2016 Podcast Listener Report [VIDEO]
The 2016 Podcast Consumer report contains all new data on podcast users in America, derived from the Infinite Dial 2016 study from Edison Research and Triton Digital.
Read MoreHow People Research Political Candidates [CHART]
TV news and TV debates are still the primary ways in which US internet users research and learn about political candidates prior to elections.
Read MoreSocial Media Sites Where Americans Get News [INFOGRAPHIC]
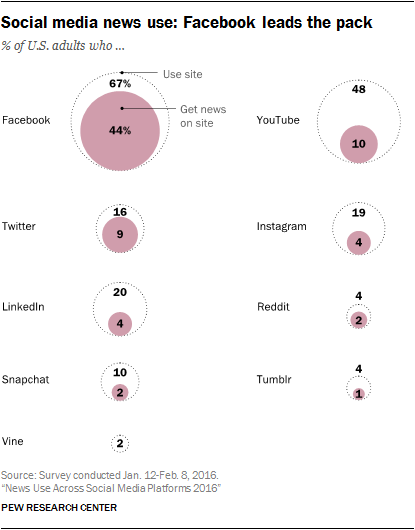
As part of an ongoing examination of social media and news, Pew Research Center analyzed the scope and characteristics of social media news consumers across nine social networking sites.
Read More