Social Media Marketing
Teen Mobile Activities [CHART]
Roughly seven in 10 US teen smartphone users spend at least three hours per day watching video on their phones.
Read MoreTeens' News Media Sources [CHART]
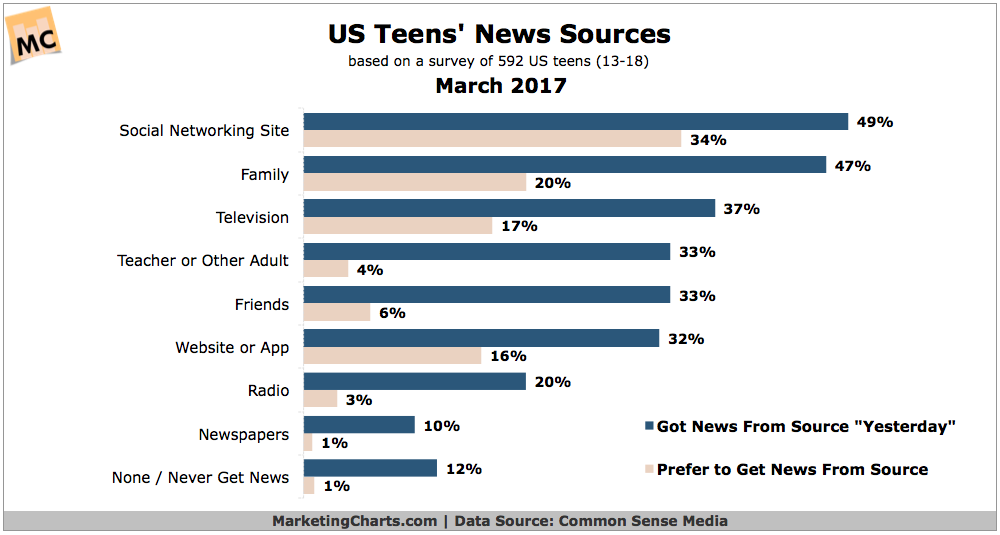
More US teens say they get their news from social networking sites (49%) and family (47%) than from any other source.
Read MoreAverage Social Shares Per Press Mention By Industry [CHART]
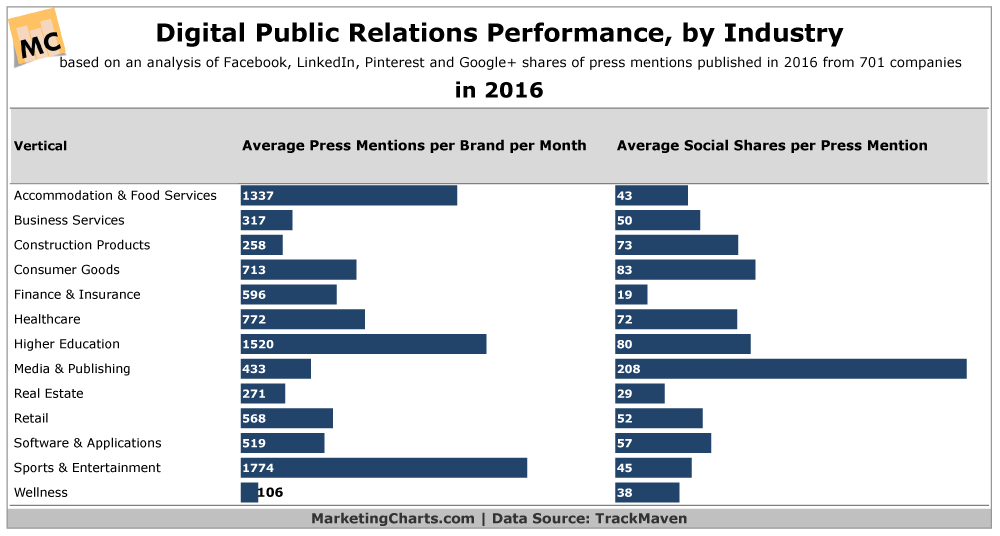
Higher education institutions got the most bang for the buck in digital PR last year, enjoying an average of more than 121,000 social shares from press mentions per month.
Read MoreGoogle Ranking Factors For Desktop Search [CHART]
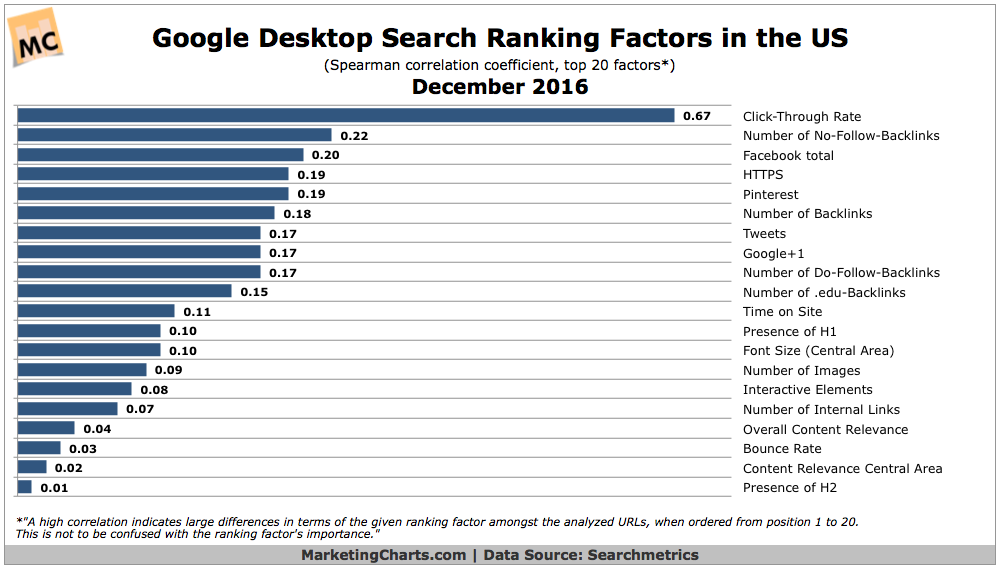
Google search ranking factors no longer apply universally but must be analyzed on an industry-specific basis.
Read MoreMost Common Topics From 99 Days Of @RealDonaldTrump Tweets [CHART]
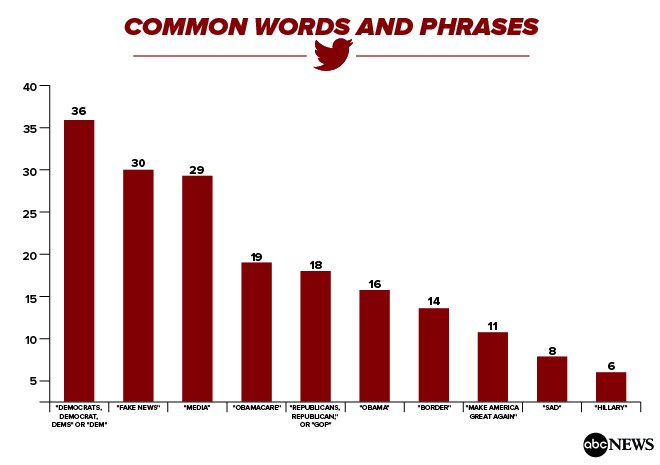
ABC News has created a tool to filter tweets from the first 99 days of @RealDonaldTrump’s presidency.
Read MoreSocial Media's Effect On Public Policy [CHART]
Nearly eight in 10 US internet users believe social media has at least some effect on public policy outcomes such as immigration and trade.
Read MoreOnline Reviews & Ratings [INFOGRAPHIC]

This infographic from Websitebuilder.org illustrates the facts and importance of online consumer reviews and ratings to a wide variety of businesses.
Read MoreTop Product Launch Communications Channels [CHART]
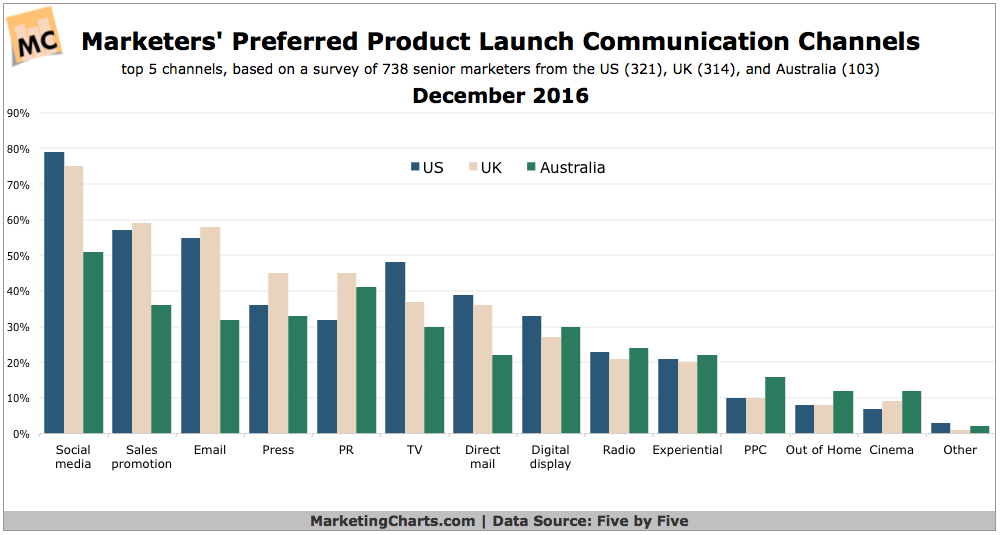
Senior marketers in the US, UK and Australia prioritize social media more than any other communications channels for product launches.
Read MoreTop Sources Of New Customers For Local Businesses [CHART]
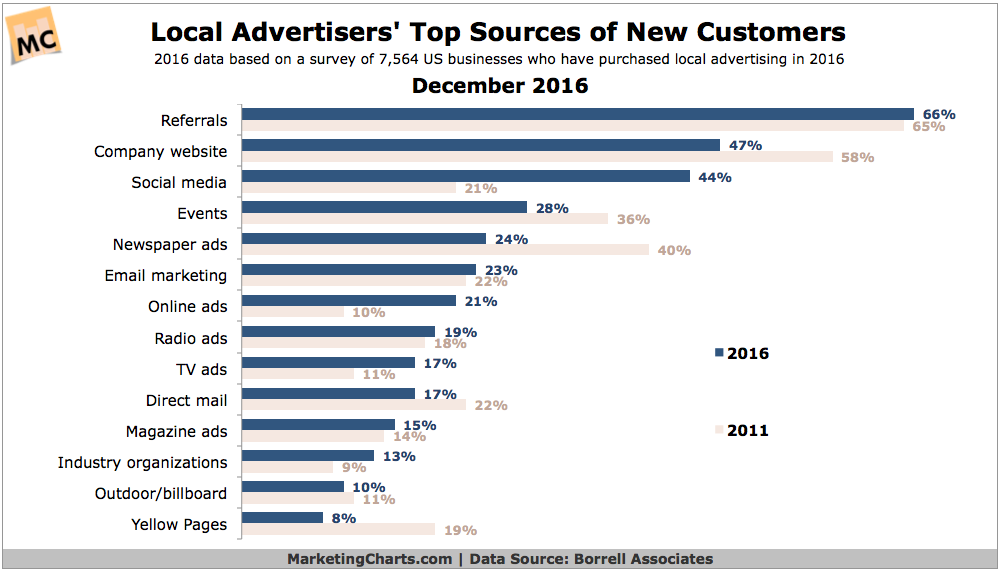
Referrals (66%) and company websites (47%) continue to be the best sources of new customers for local advertisers, much as they were back in 2011.
Read MoreFacebook Advertising Benchmarks [INFOGRAPHIC]
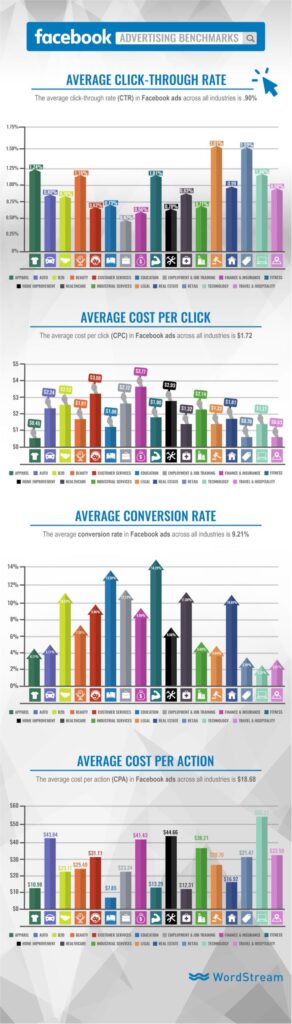
This infographic from WordStream illustrates the most important Facebook advertising benchmarks, including click-through rate, cost-per-click, conversion rate, and cost-per-action across 18 different industries.
Read More