Social Media Marketing
9 LinkedIn Advertising Tips [INFOGRAPHIC]
This infographic from LinkedIn lists nine tips for advertising on the social network, based on the social network’s 2018 advertising guide.
Read MoreMarketing Budget Trends For Industrial Companies In 2017 [CHART]
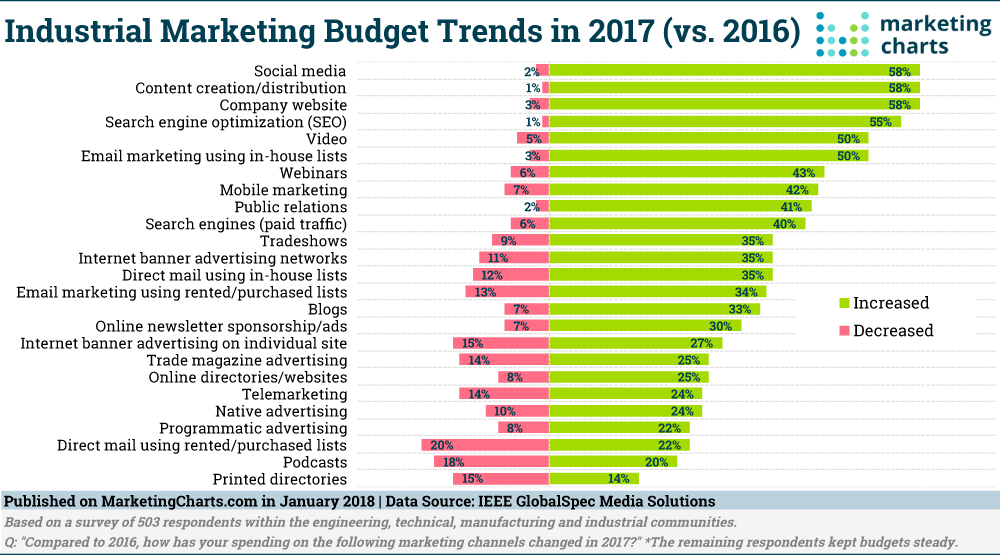
Almost 8 in 10 industrial marketers increased (31%) or maintained (48%) their budgets in 2017 relative to 2016. Websites, content and social media were the areas in which the most industrial marketers increased their spending in 2017, with 58% doing for each channel.
Read MoreInstagram User Penetration, 2016-2021 [CHART]
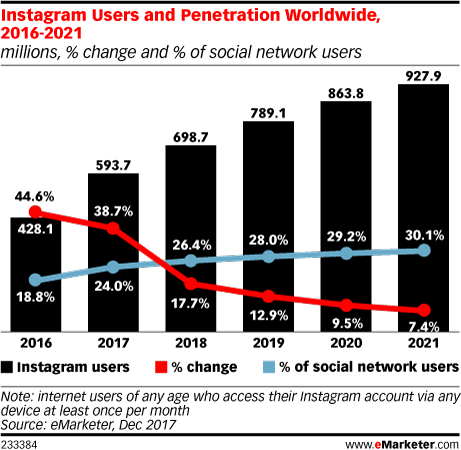
One in three people—2.48 billion—worldwide used a social network in 2017, eMarketer estimates. Rising social network use in emerging markets in Asia-Pacific, Latin America and the Middle East and Africa drove an 8.7% gain over 2016.
Read MoreFacebook Average Revenue Per User [CHART]
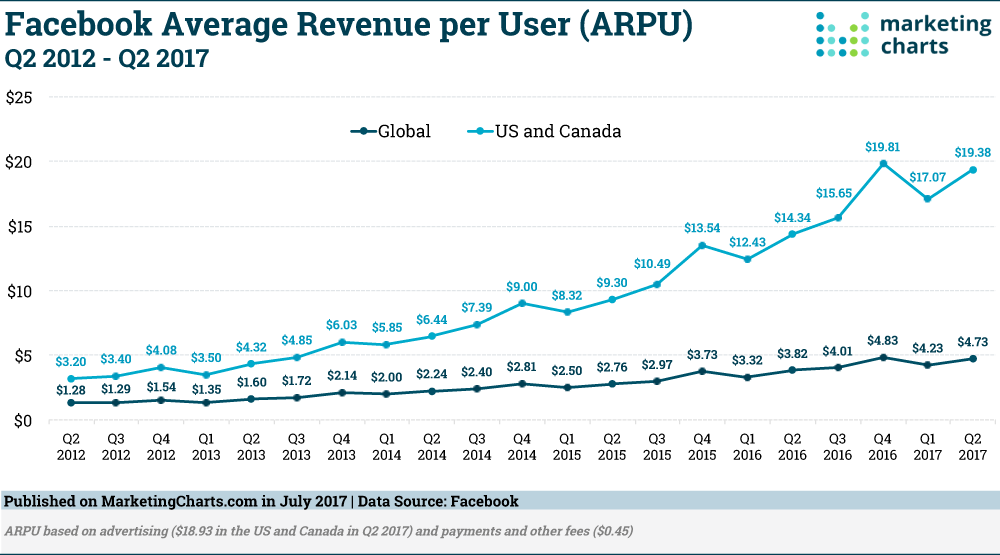
Facebook’s average revenue per user continues to be far higher in the US and Canada than the world over – in fact more than 4 times higher in Q2 2017.
Read MoreSatisfaction With Social Media Sites [CHART]
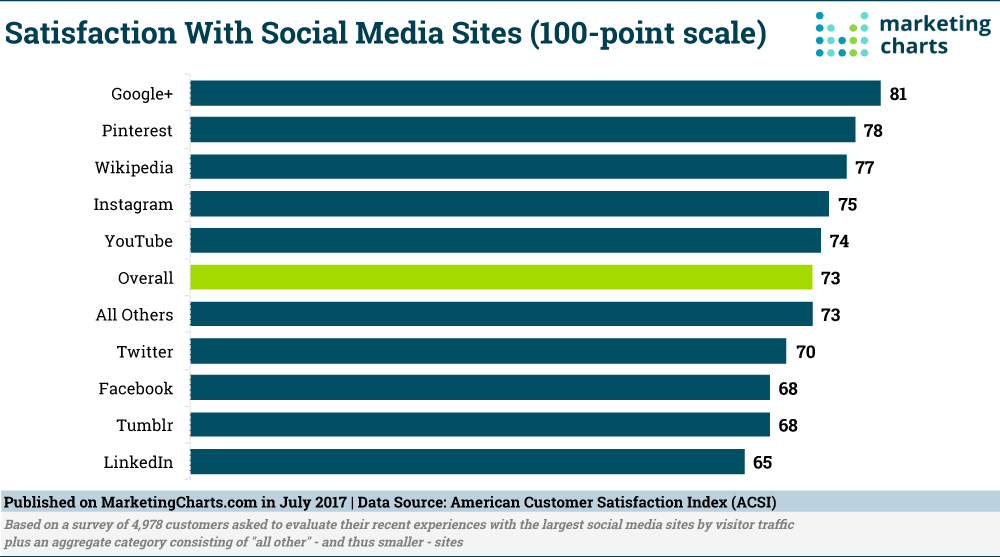
Social media user satisfaction remains steady this year though it is still in the lower tier of industries on this measure. The overall index for social media is unchanged at 73 on a 100-point scale, though some platforms are better rated than others.
Read MoreUsing Social Media For Customer Retention [INFOGRAPHIC]
It costs seven times more to acquire a new customer than it does to retain an existing one. This infographic from Branex illustrates seven ways you can use social media for customer retention.
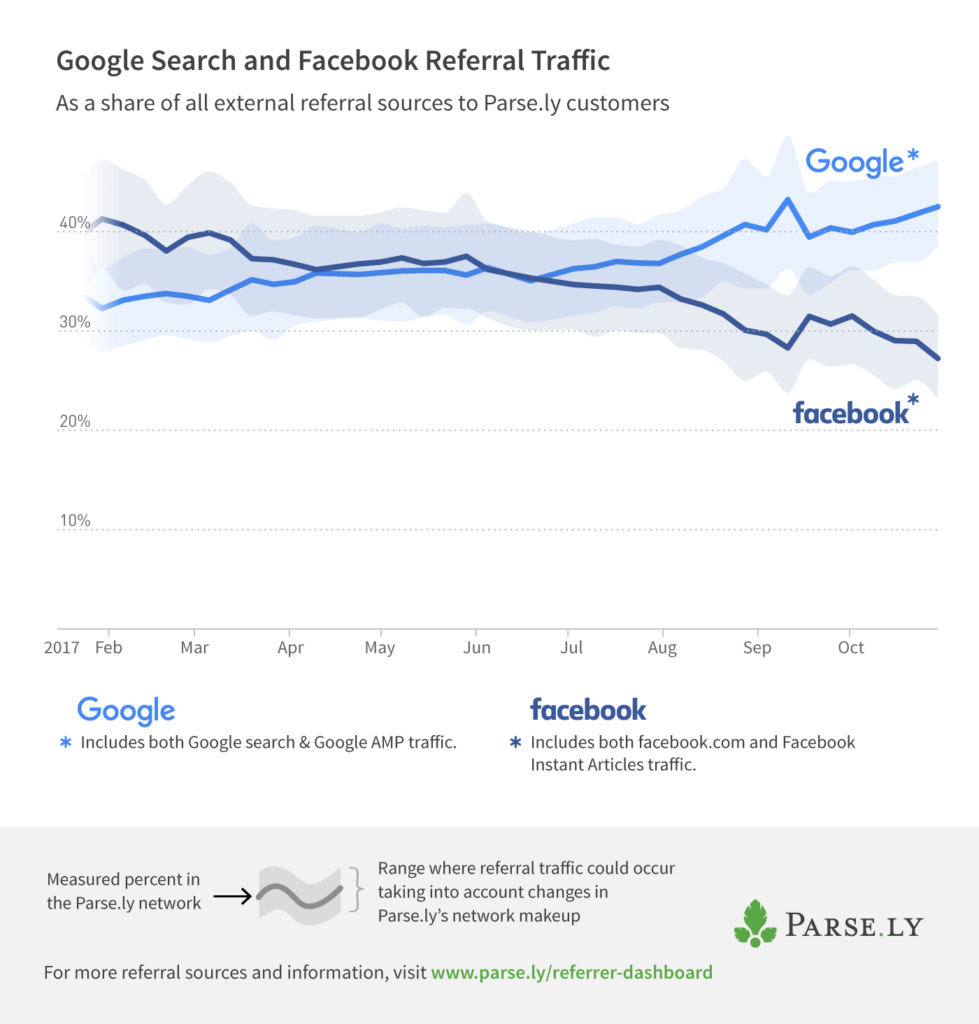
Read MoreGoogle vs Facebook Referral Traffic, 2017 [CHART]
This Parse.ly data reflects the upward trend in referral traffic from Google (all – including AMP – Google’s Accelerated Mobile Pages format) and declining trend in referral traffic from Facebook specifically (all Facebook – including Instant Articles).
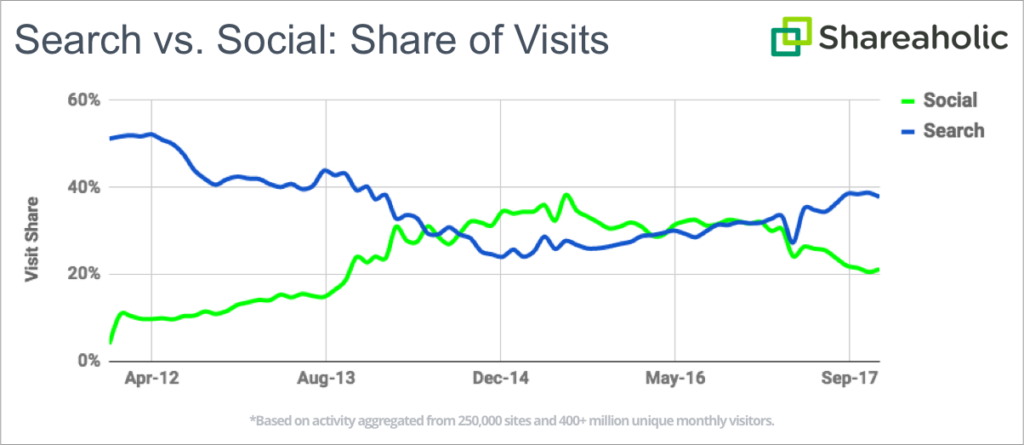
Read MoreSearch Engine vs Social Traffic, 2011-2017 [CHART]
Google was the top overall traffic referrer for the year, and owned a 36.82 percent share of visits during the second half of 2017.
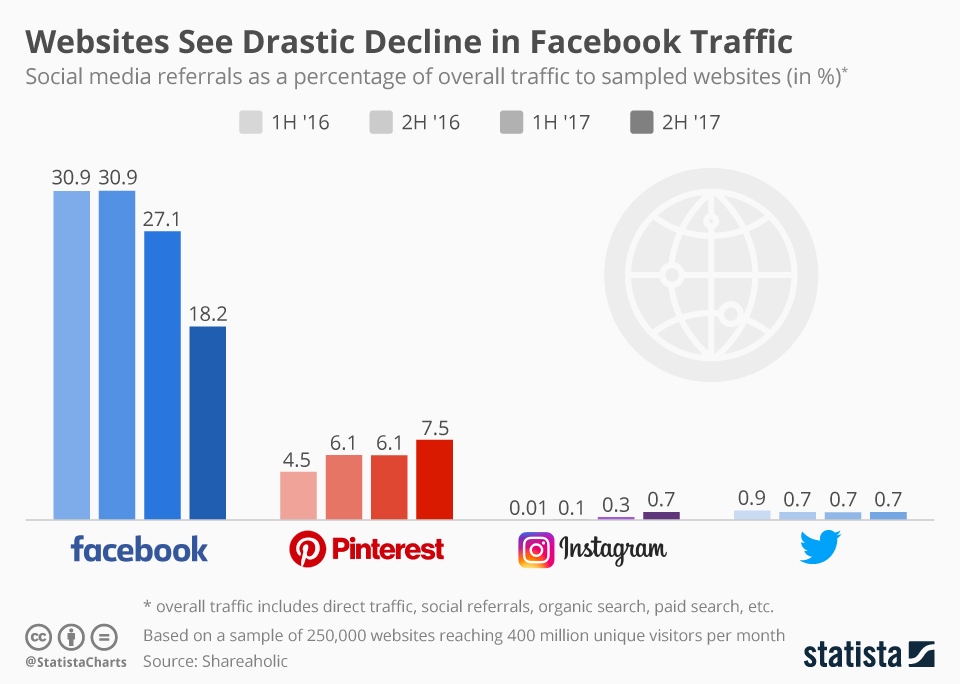
Read MoreWebsite Referrals By Social Channel, 2016-2017 [CHART]
According to a report by Shareaholic, the percentage of website traffic coming from Facebook has already declined drastically in the second half of 2017.
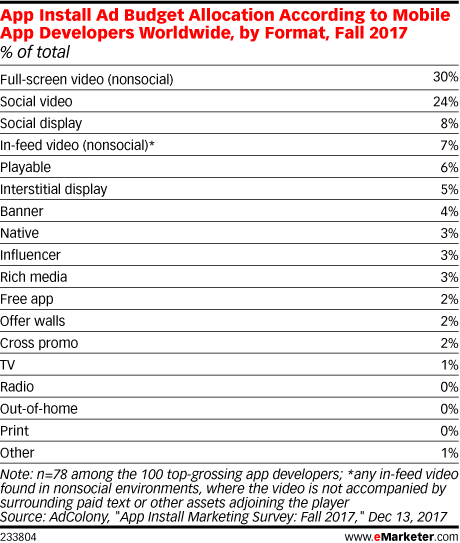
Read MoreApp Install Ad Budget Allocations [TABLE]
Mobile app developers worldwide were directing the majority of their install marketing budgets to video. When added together, various types of video made up 61% of app install budget allocation in fall 2017.
Read More
