Social Media Marketing
Top 10 Web Brands Of 2012 [CHART]
According to Nielsen, Americans on the web were most inclined to search, socialize, shop, browse or, of course, look things up on Wikipedia.
Read MoreLeading Social Media Marketing Tactics, April 2012 [TABLE]
46% of US marketers reportedly used Facebook messaging as a marketing tactic. However, when looking toward the next 12 months, only 19% said they planned to continue using Facebook private messages.
Read MoreFrequency Of Facebook Messages Use, December 2012 [CHART]
26% of surveyed US Facebook users reported sending and receiving messages often. Moreover, 35% said they sometimes used the messaging feature.
Read MoreFrequency Of Mobile Social Network Visits, July 2011 & March 2012 [CHART]
In the US, 60% of smartphone users surveyed by Google in March 2012 reported that they visited mobile social networks daily, up from 54% in July 2011.
Read MoreDevices On Which People Access Social Media, 2011 & 2012 [CHART]
There is no question that social media has gone mobile, as more and more consumers access their accounts via smart phones and tablets.
Read MoreDaily Time Spent Social Networking By Demographic, January 2013 [CHART]
Americans aged 18-64 who use social networks say they spend an average of 3.2 hours per day doing so.
Read MorePreferred Social Logins, Q4 2012 [CHART]
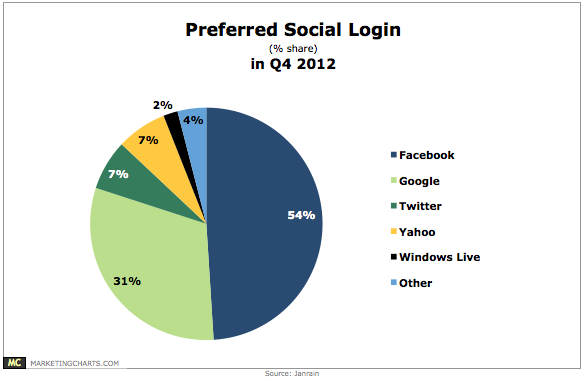
Facebook was once again the leading option in Q4 2012 for social logins.
Read More
Online & In-Store Holiday Purchase Influencers, January 2013 [CHART]
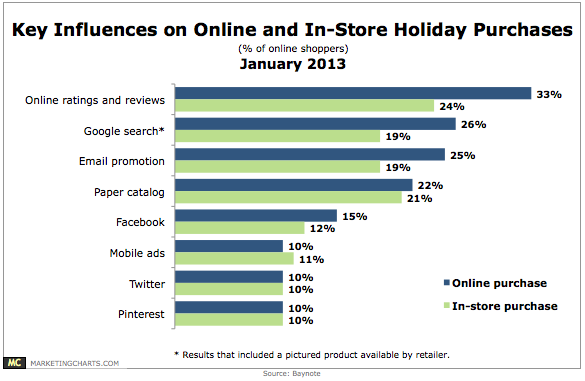
Pinterest and Twitter influenced online and in-store purchases for just 1 in 10 shoppers surveyed, with Facebook garnering only slightly more interest.
Read MoreFacebook Ad Spending By Mobile Devices, January 2013 [CHART]
Mobile devices (phones and tablets) now account for 20.3% of overall Facebook ad spending.
Read More