Social Media Marketing
Time Spent Online By Gender & Generation, 2011 vs 2012 [CHART]
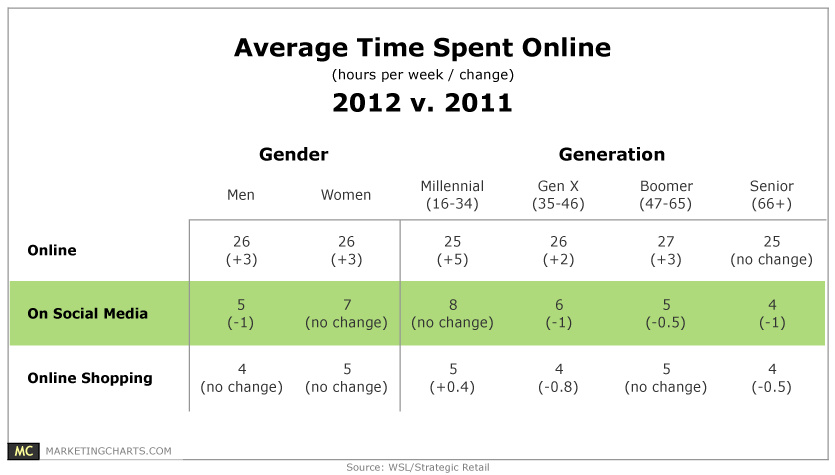
Online Americans spent slightly more than one day a week online last year, increasing their average online time by 3 hours to 26 hours.
Read MoreHoliday eCommerce Traffic Sources, January 2013 [CHART]
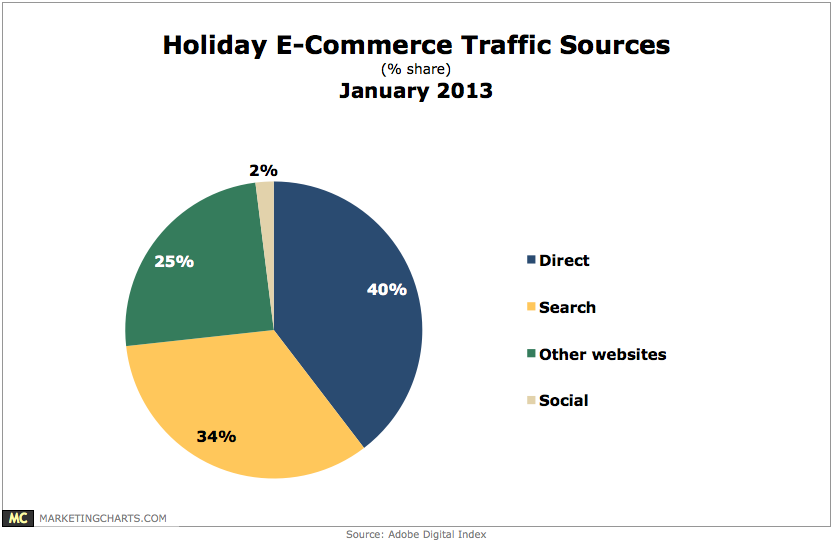
Only 2% of traffic to retailers during the holiday season came from social networks.
Read MoreBrand-Connected Consumers' Attitudes Regarding Social Feedback, January 2013 [CHART]
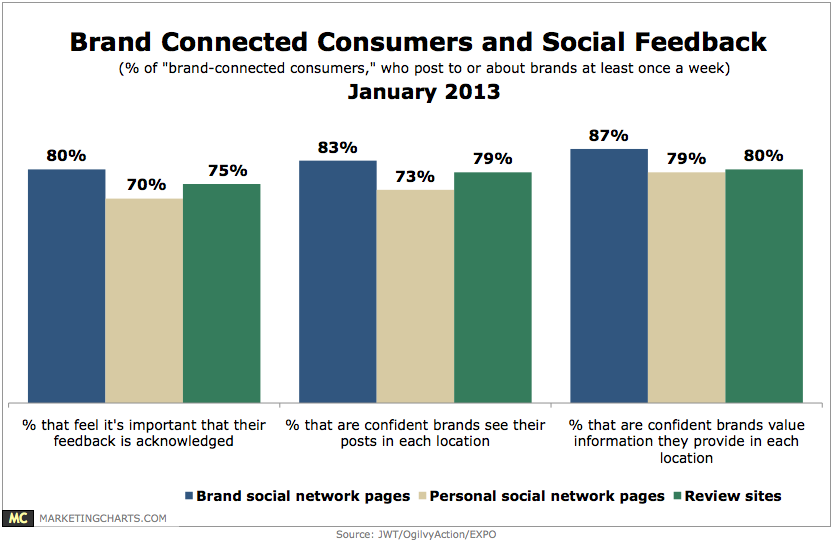
8 in 10 consumers digitally engage with brands, while one-quarter are brand-connected consumers who both post to and about brands online at least once a week.
Read More
Americans' Engagement With Brands On Social Networks By Demographic, January 2013 [CHART]
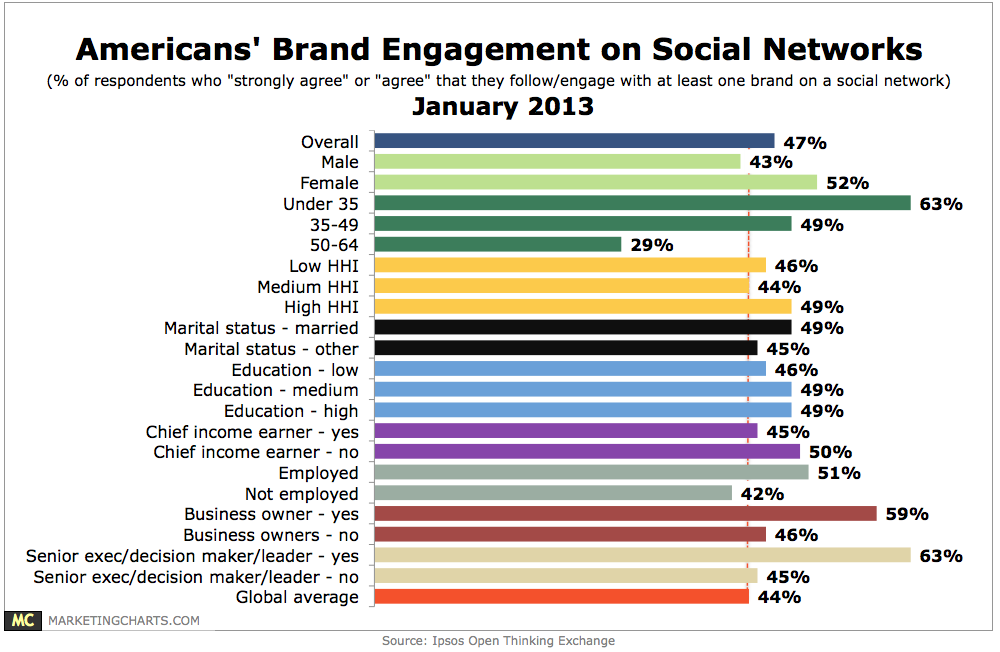
47% of Americans agree that they follow or engage with at least one brand on a social networking site.
Read MoreReasons People Bypass Social Logins, December 2012 [CHART]

Simply not wanting one’s every online move posted to social networks was named by four out of 10 respondents as the reason they avoided social logins.
Read MoreBenefits Of Social Logins, December 2012 [CHART]
47% of US internet users have never logged in to a website or mobile app using social sign-in.
Read MoreGeneration V Social Network Behavior, February 2012 [CHART]
Social networking is also becoming more common among kids, despite being strictly forbidden for those under 13. Once again, gaming is one of kids’ favorite social media activities.
Read MorePhysicians' Online Content Consumption, Q1 2012 [CHART]
The most time spent online by US physicians was for so-called Health Care Providers content.
Read MoreTime Spent Online By American Physicians By Category, Q1 2012 [CHART]
The internet has become an integral part of clinical practice, allowing physicians to stay up to date on healthcare treatments, medications and payer guidelines.
Read More