Social Media Marketing
Time Spent On iOS & Android Devices By Activity, April 2013 [CHART]
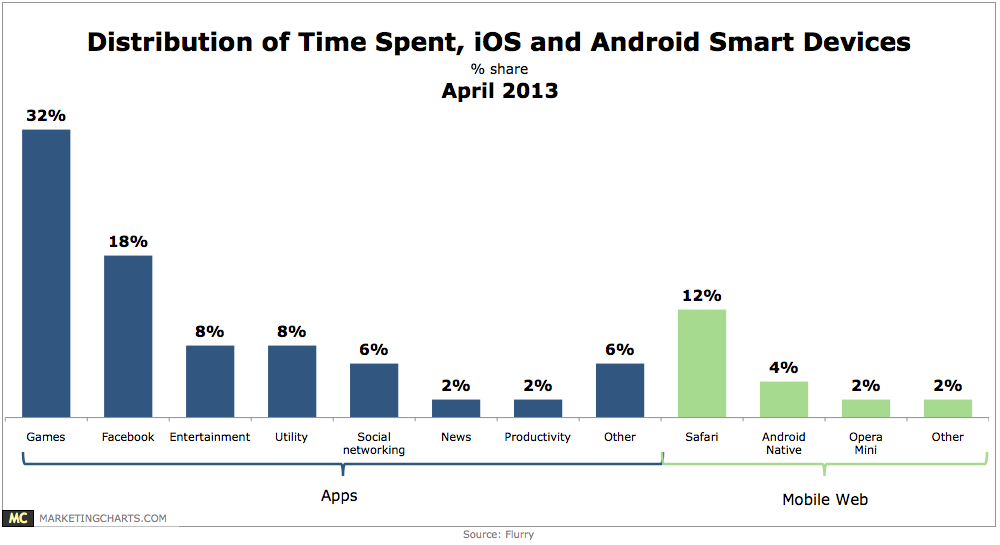
Android and iOS smart phone and tablet users spend an average of 2 hours and 38 minutes per day on their devices.
Read MoreTop 10 Online Video Properties By Unique Viewers, December 2012 [TABLE]
Google sites made up the vast majority of online video viewership in the US in terms of unique viewers, videos viewed and time spent per viewer.
Read MoreChannel ROI Ratings, April 2013 [CHART]
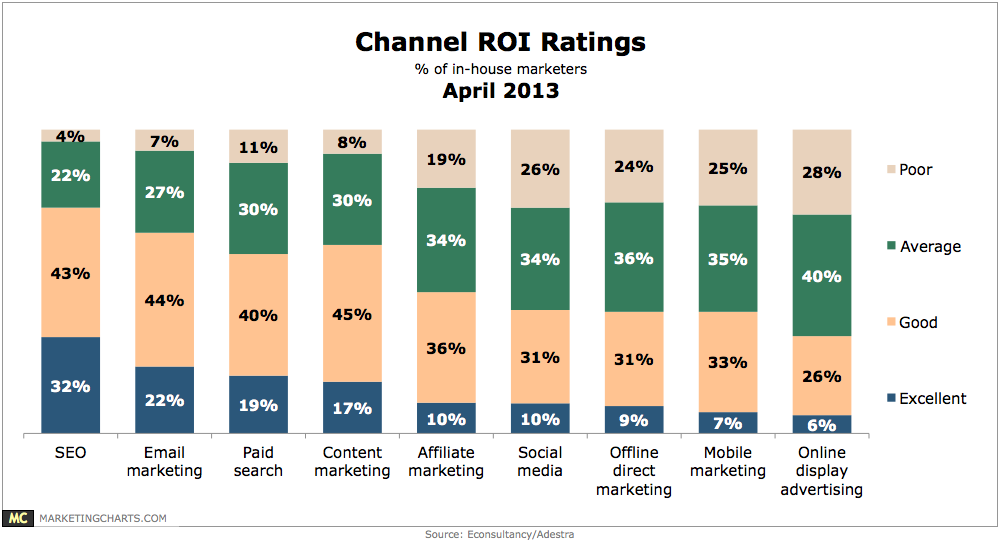
75% of global marketers (primarily from the UK) rate SEO as “excellent” (32%) or “good” (43%) in terms of return on investment.
Read More
B2B Marketing Budgets [INFOGRAPHIC]
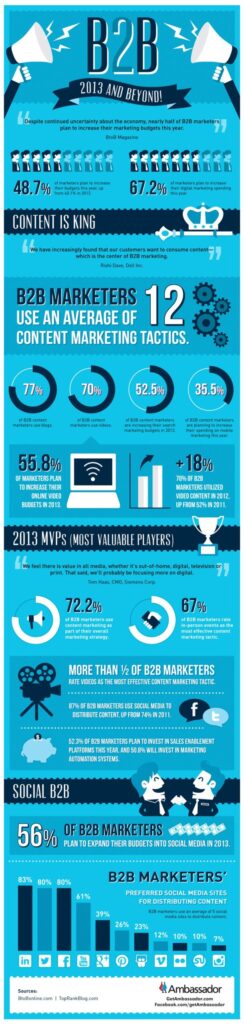
This infographic by Ambassador illustrates how B2B marketers are spending in 2013.
Read MoreAverage Number Of Facebook Friends By Age, April 2013 [CHART]
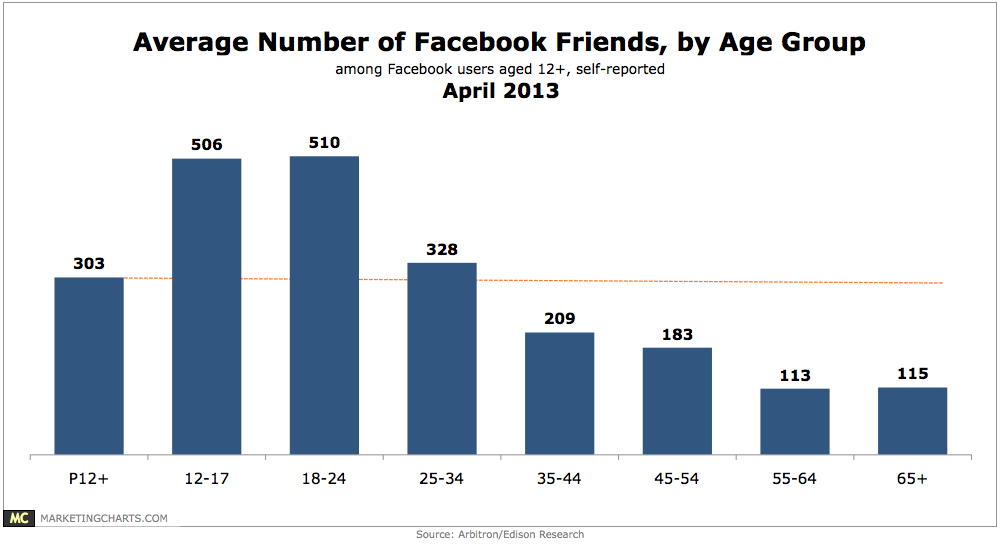
62% of Americans aged 12 and up report having a profile on a social network, and Facebook is easily dominant, used by 58% of Americans of that age.
Read MoreHow Brands Foster Consumer Connectedness, April 2013 [CHART]
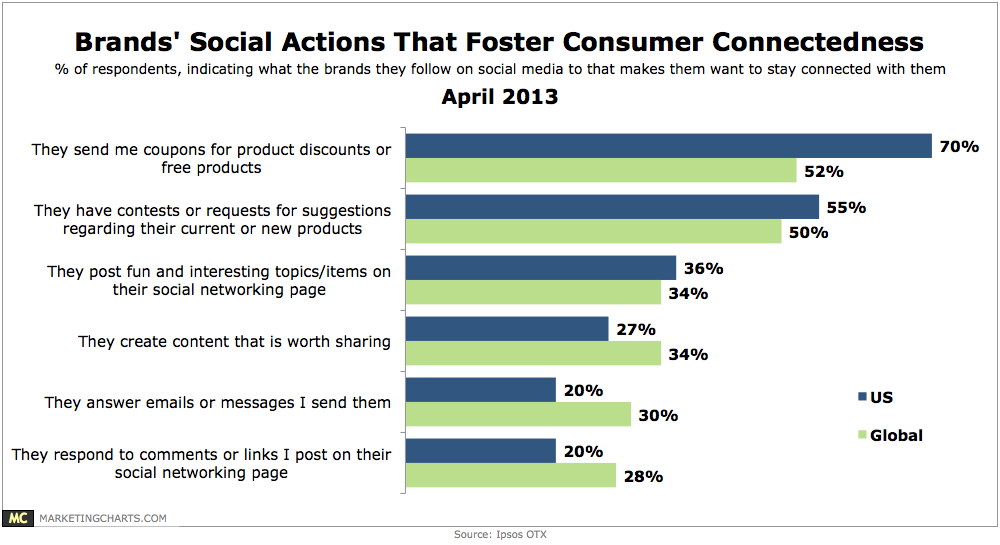
Asked what the brands they follow on social media do to make them want to stay connected to them, 70% said brands send them coupons for product discounts or free products.
Read MoreBeyond Social Media: Macy's $1,453 Typo; Yelp Reviews; Prankvertising; Kevin Ware & Social Empathy [PODCAST]

This week: Macy’s $1,453 Typo; Yelp’s Filtered Reviews; Nike’s Winning Ad Lampooned; Prankvertising; Kevin Ware & Social Empathy; Silent Instagram Film Trailers; Punch Pizza Goes To Naples; HP’s Bouncing Cam; Blogging Rules; Shiny New Stuff & Daily Numbers.
Read MoreContent Sharing Trends, April 2013 [TABLE]
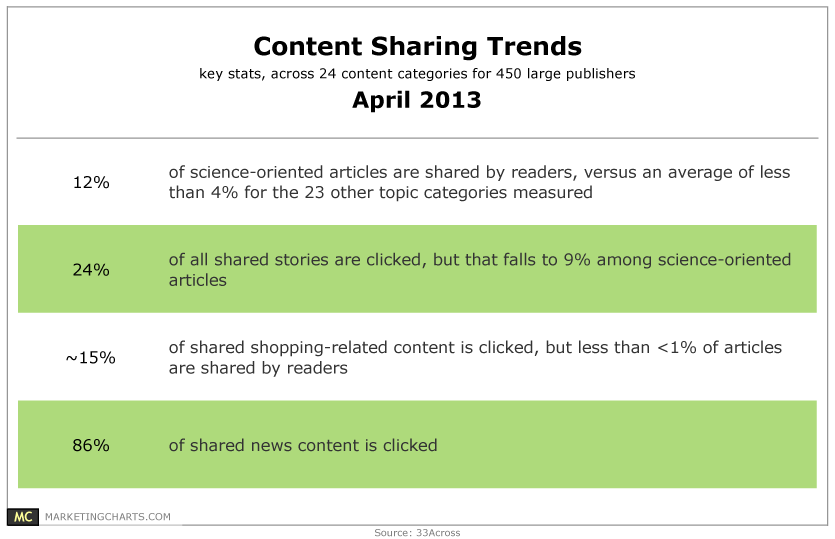
The types of content that people share may be driven more by ego than anything else.
Read MoreClick-Through Rates For Emails That Include Social Sharing, April 2013 [CHART]
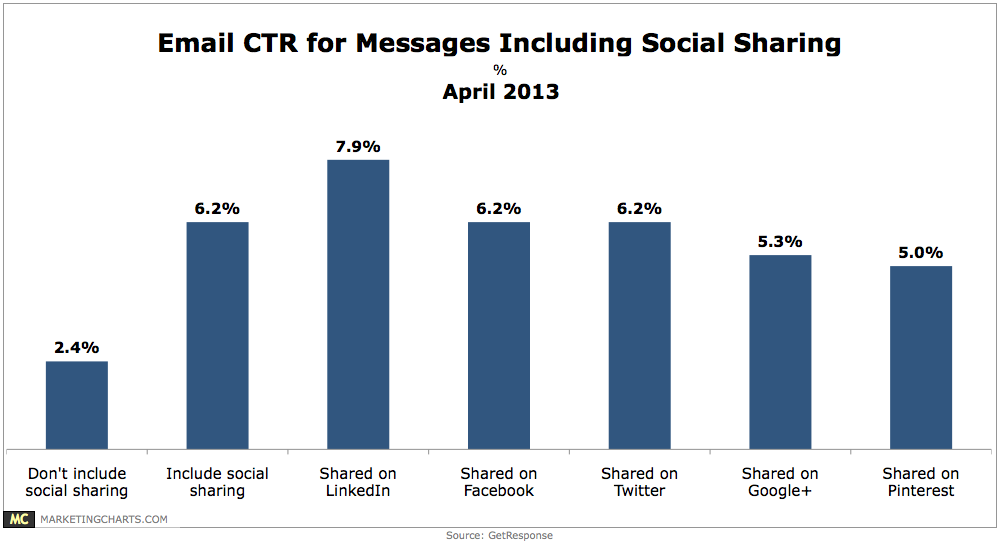
Emails that include social sharing buttons have a click-through rate 158% higher than those do not (6.2% vs. 2.4%).
Read More