Social Media Marketing
Daily Search Marketing Tactics, Q3 2012 [CHART]
The rising tide of mobile queries brought several search engine optimization (SEO) matters to a head in 2012.
Read MoreUS Local Mobile vs Desktop Search Volume, 2011-2016 [CHART]
Google estimated that 20% of searches across all platforms worldwide have local intent.
Read More
Share Of Americans' Time Online By Category, 2011 vs 2012 [CHART]
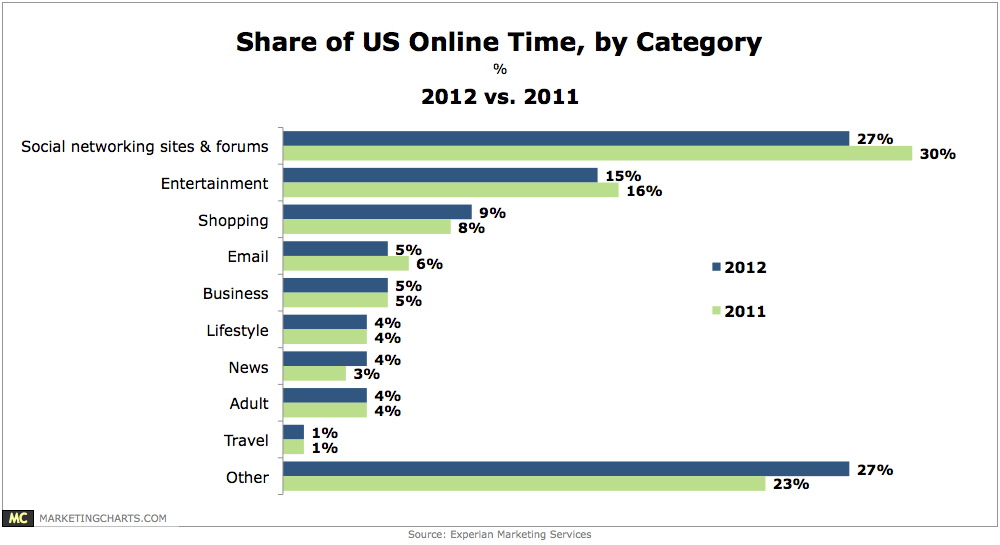
27% of Americans’ time spent online last year was spent accessing social networking sites and forums.
Read MoreOnline Ad Price Trends By Ad Type, January vs March 2013 [CHART]
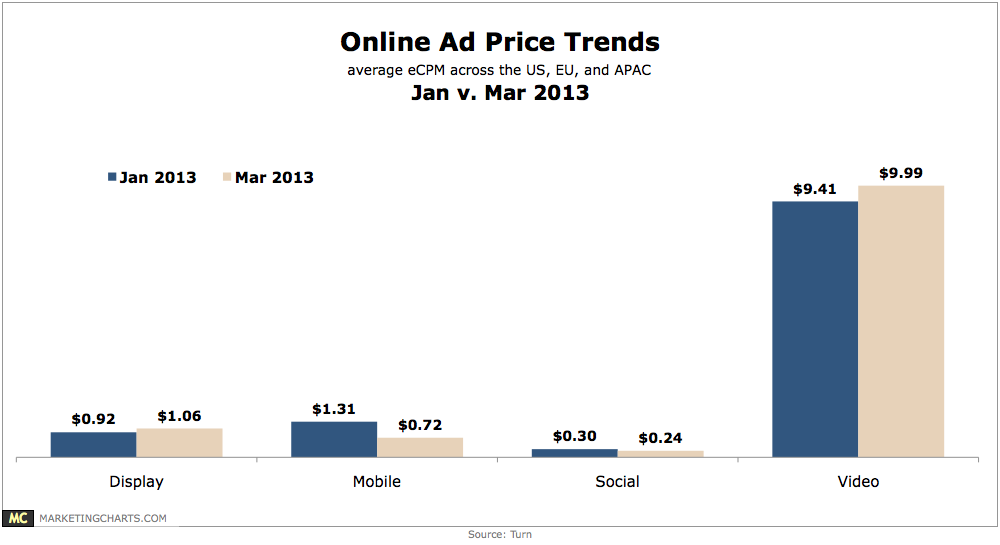
Average video eCPMs increased 6.2% between January and March 2013, from $9.41 to $9.99, while display ad prices grew by 15.2% from $0.92 to $1.06.
Read MoreCPG Mobile Advertising Post-Click Actions, 2012 [CHART]
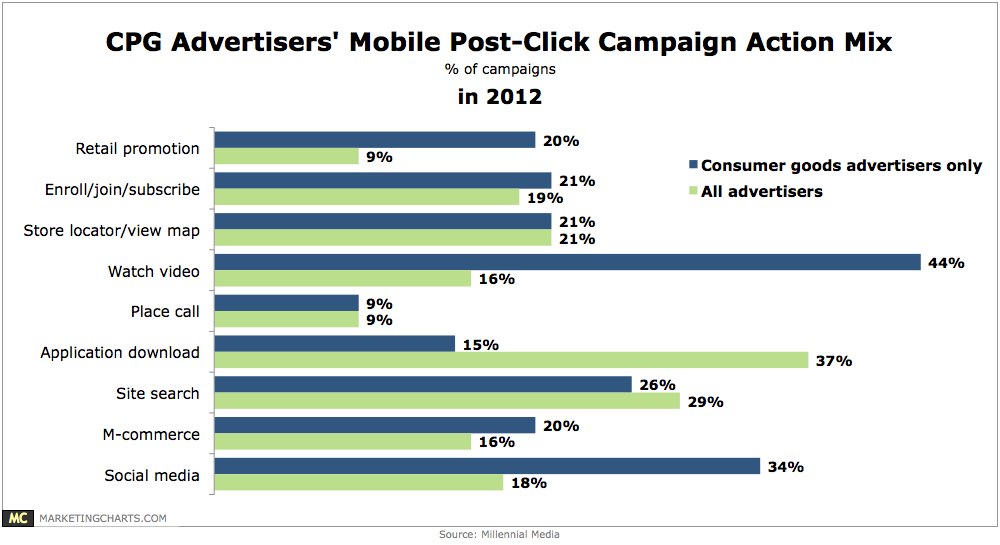
CPG brands were more focused on encouraging consumers to watch video, with 44% of the campaigns incorporating a video aspect (compared to 16% on average).
Read More
Profile Of Global Digital Elite, April 2013 [TABLE]
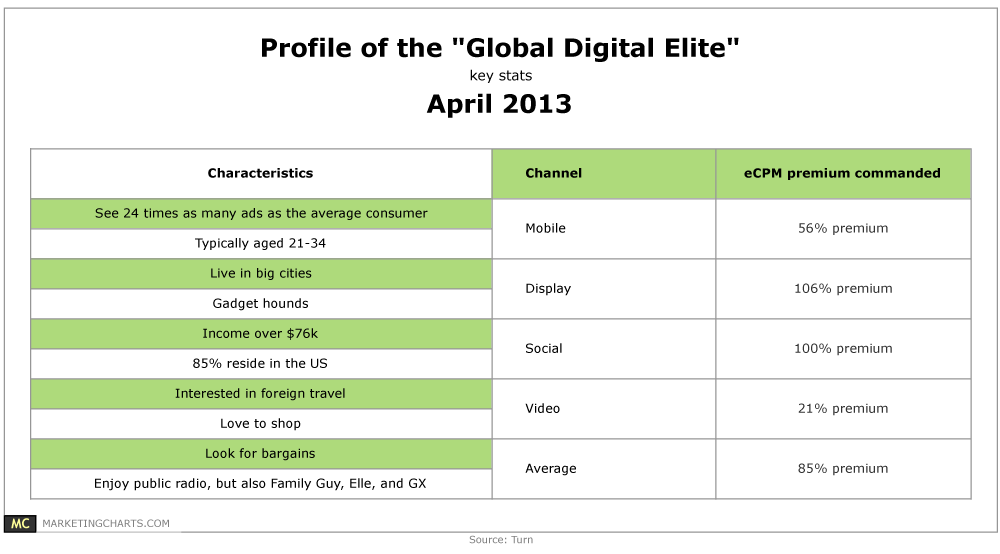
These 2% of global consumers – the “global digital elite” – see 24 times as many ads as the average consumer, and are so prized by marketers that they command 85% higher eCPMs than average.
Read MoreSocial Video Advertising Shares By Industry, Q1 2013 [CHART]
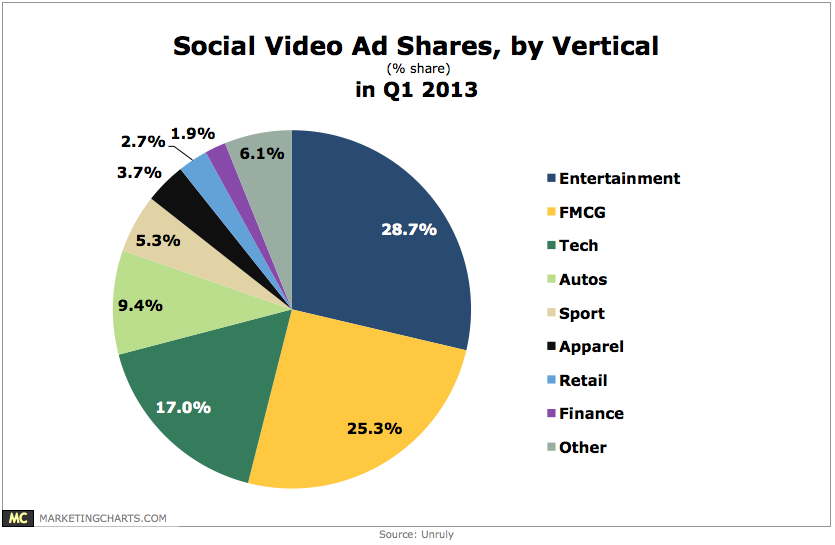
Fast-moving consumer goods ad campaigns generated almost 8.7 million shares during the quarter, up 78.2% from Q4 2012, and representing 25.3% of all shares.
Read MoreChallenges & Concerns About Using Social Media For Health Care Marketing, October 2012 [CHART]
Health care marketers worry about how to measure social media marketing efforts, especially tying the investment in social media directly to brand objectives.
Read More