Social Media Marketing
Global Social Network User Penetration By Region, 2011-2017 [TABLE]
Through 2015, the more advanced social network markets of North America, Western Europe and Central and Eastern Europe will have the highest penetration rates worldwide.
Read MoreSocial Network Users By Region & Country, 2011-2017 [TABLE]
Though Asia-Pacific will have the largest social network population worldwide through 2017 and the Middle East and Africa will have the second-largest audience starting next year, their population penetration rates are among the lowest.
Read MoreGlobal Social Network Users, 2011-2017 [CHART]
The number of social network users around the world will rise from 1.47 billion in 2012 to 1.73 billion this year, an 18% increase. By 2017, the global social network audience will total 2.55 billion.
Read MoreBest Sources For Marketing & Advertising, June 2013 [CHART]
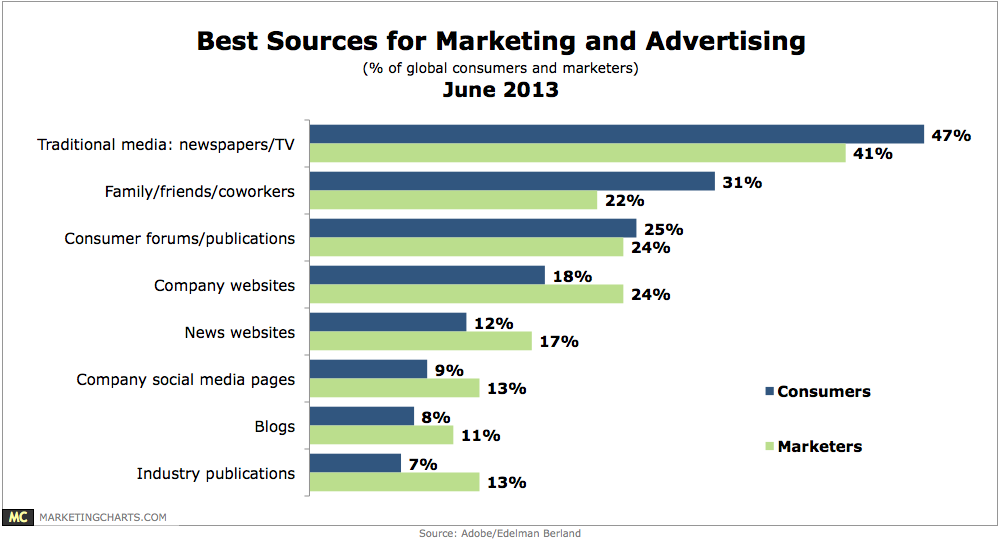
Consumers were more likely than marketers to choose traditional media sources such as newspapers and TV as best for advertising (47% vs. 41%), and also more likely to see their family, friends and co-workers as influential (31% vs. 22%).
Read MoreCustomer Frustration With Companies' Online Communications, June 2013 [CHART]
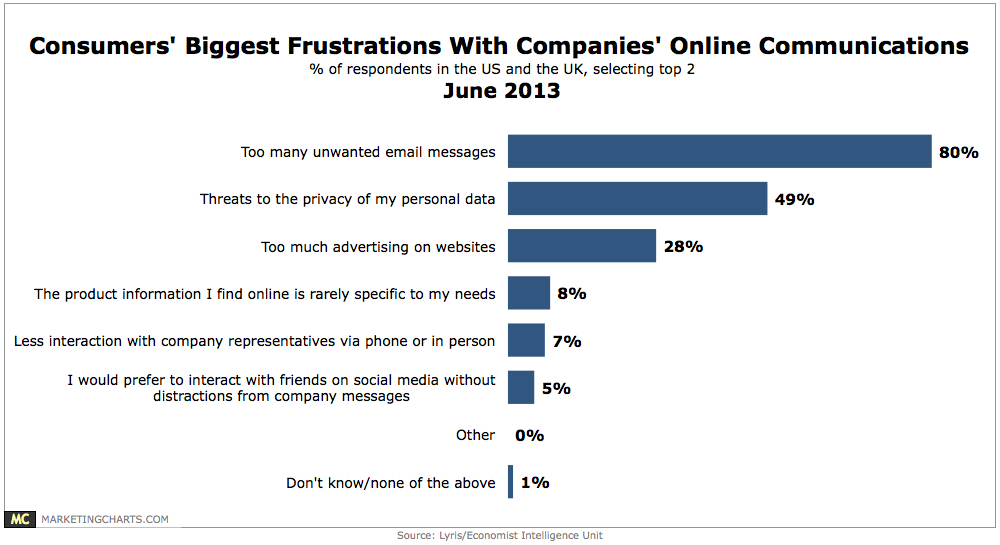
80% consumers in the US & UK said that one of their top 2 frustrations about companies’ use of online communications was too many unwanted email messages.
Read MoreFacebook Ad Performance By Industry, Q1 2013 [CHART]
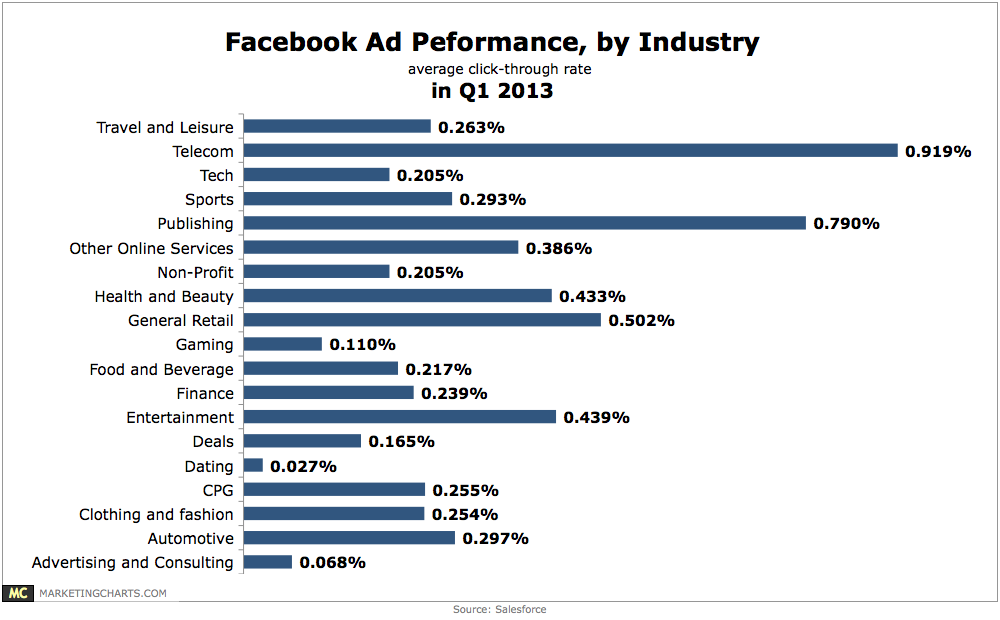
Telecom (0.919%) and publishing (0.79%) brands are leading the charge in Facebook click-through rates.
Read MoreHow People Find Websites, 2011 vs. 2012 [CHART]
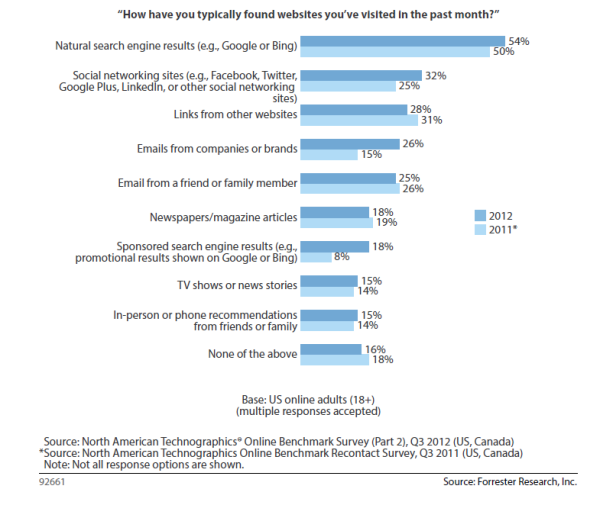
54% of respondents found websites through natural search results in 2012, up from 50% in 2011.
Read MoreWhy People Watch A Particular Television Show, June 2013 [CHART]
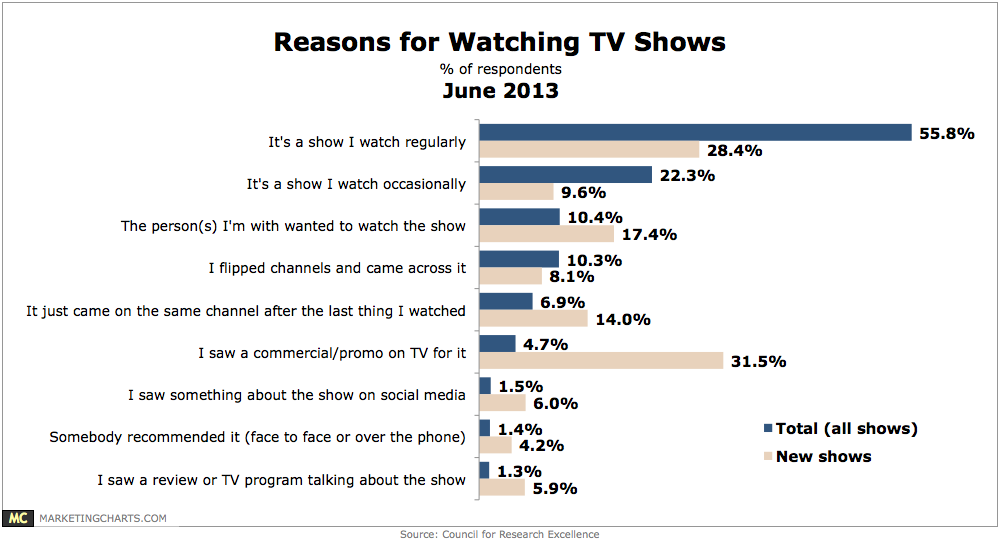
The proportion of study respondents who interact with TV-related content on social media on at least a weekly basis is triple those who do so on a daily basis (37% vs. 12%).
Read MoreThe History Of Public Relations [INFOGRAPHIC]
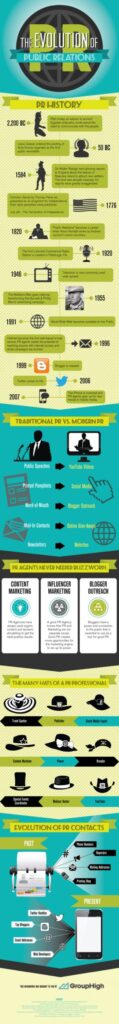
This infographic about the history of public relations was created by GroupHigh.
Read MoreFacebook Ad Performance By Industry, Q1 2013 [CHART]

Telecom (0.919%) and publishing (0.79%) brands are leading the charge in click-through rates.
Read More