Social Media Marketing
Americans Sick Of Social Media Marketing By Demographic, October 2013 [CHART]
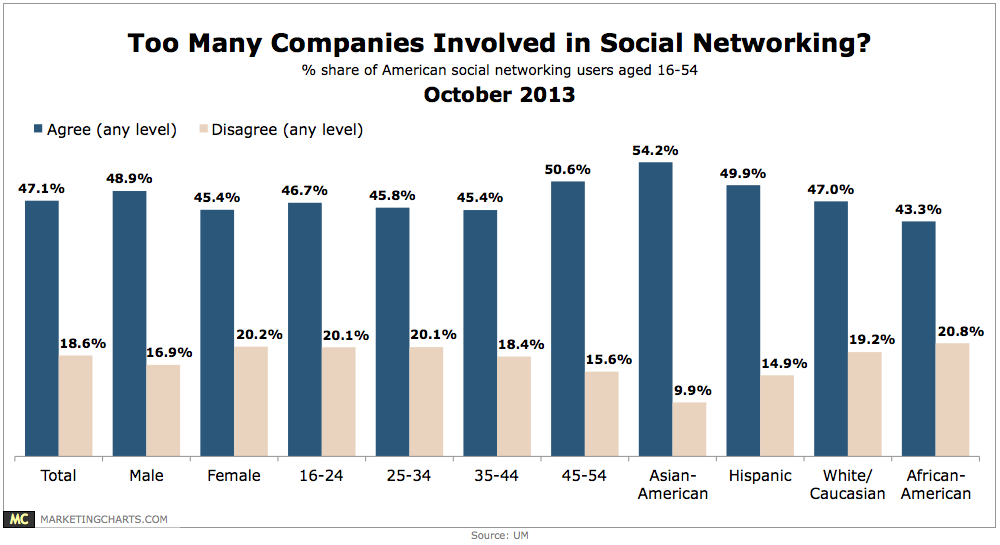
47.1% of Americans who had been active on any type of social network in the previous 6 months indicated some level of agreement that too many companies are on social media.
Read MoreSocial Media Traffic Referral Trends, September 2012-September 2013 [CHART]
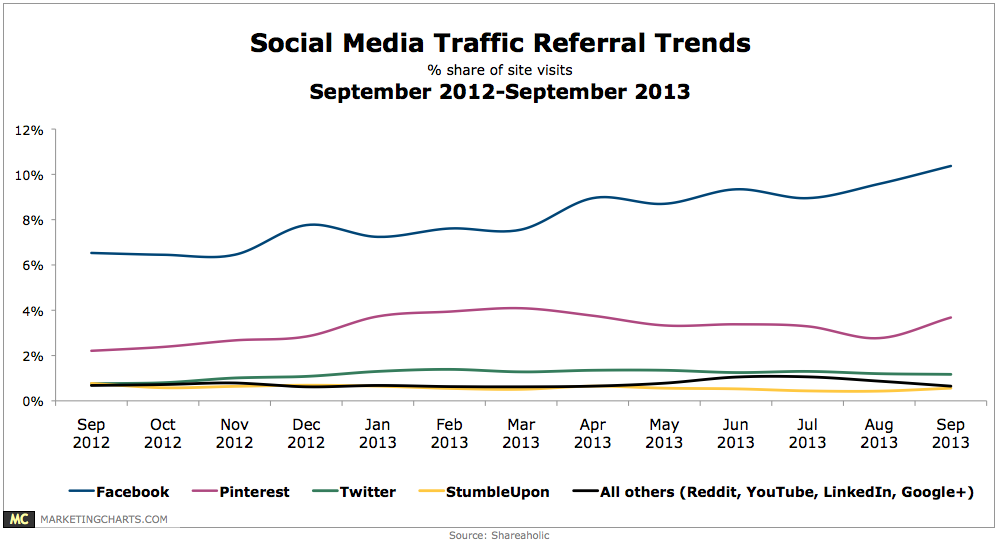
Facebook is easily the leading social referrer of traffic, confirms a new report from Shareaholic, which analyzed 13 months of data collected from 200,000 publishers reaching more than 250 million unique monthly visitors.
Read MoreGlobal Social Login Preferences For Entertainment & Gaming Sites, Q2 2011-Q3 2013 [CHART]
62% of visitors to entertainment and gaming sites preferred using a Facebook sign-in, while only 20% favored Google.
Read MoreSocial Logins Preferred For B2B Sites, Q4 2012-Q3 2013 [CHART]
Among visitors to business-to-business sites, LinkedIn was just as likely to be preferred as Google in Q3 2013, although both trailed Facebook.
Read MorePreferred Social Logins, Q2 2011-Q3 2013 [TABLE]
Facebook was the overall favorite among users who wanted social identification, named by 44.9% of respondents.
Read MoreB2C vs B2B Content Marketing, October 2013 [TABLE]
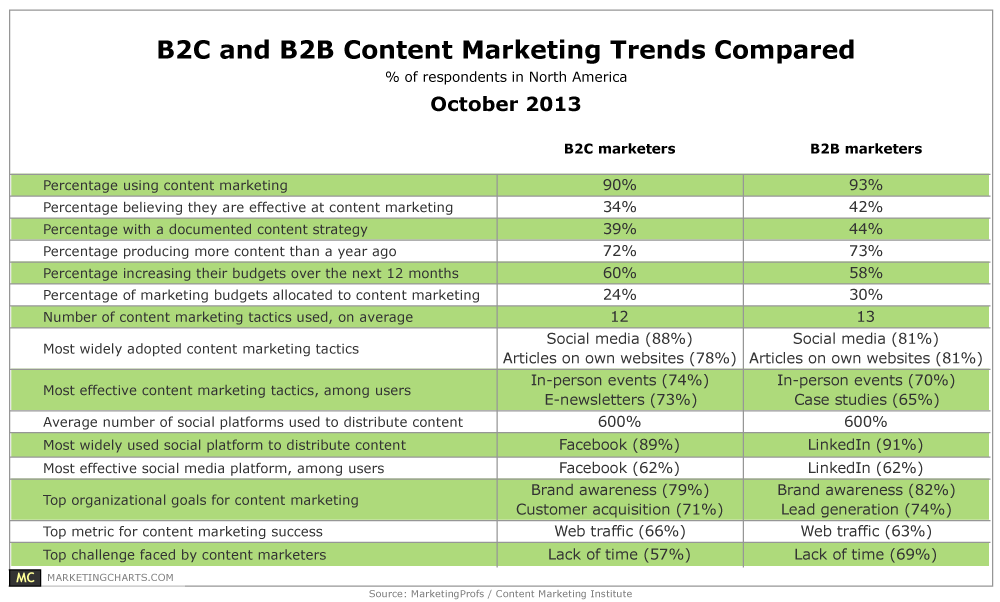
B2B marketers have traditionally invested more of their budgets into content marketing than their B2C counterparts.
Read MoreMost Difficult Inbound Marketing Tactics, September 2013 [TABLE]
Content creation & marketing was seen as both the most effective and most difficult inbound marketing tactic in a survey of B2B and B2C marketing professionals.
Read MoreImportance Of Social Media To Americans By Select Demographics, October 2013 [CHART]
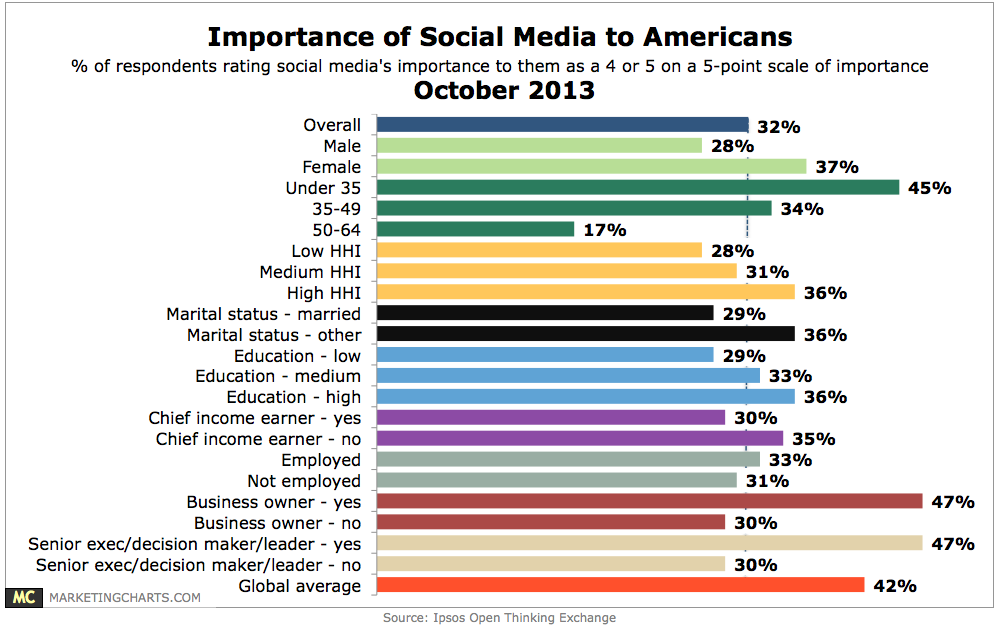
Asked how important social media is to them, only 32% of Americans aged 18-64 rated social’s importance a top-2 box score on a 5-point scale.
Read MoreTop Metrics Used To Measure Native Advertising, June 2013 [CHART]
The majority of US marketers used engagement to measure native advertising.
Read MoreFacebook Advertising Key Performance Indicators [INFOGRAPHIC]
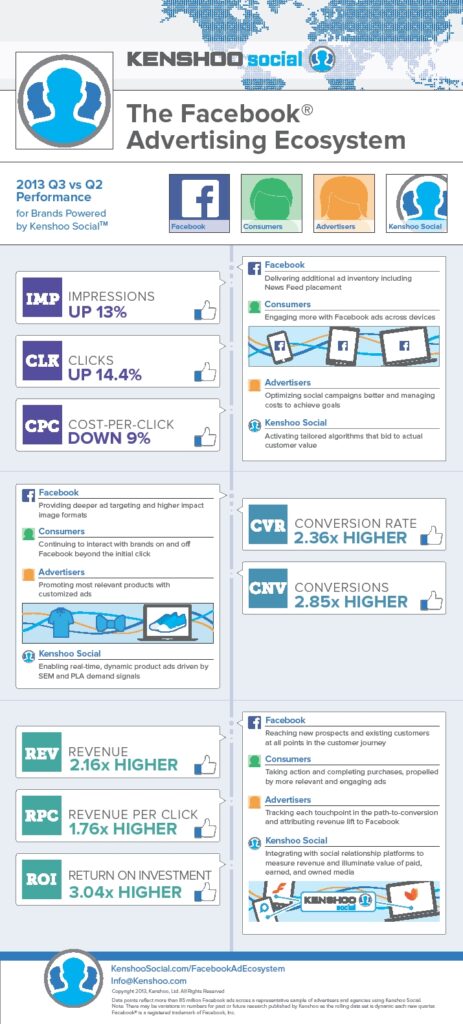
This infographic by Kenshoo Social (via AllFacebook) illustrates the key performance indicators for Facebook advertising for Q2 vs Q3 2013.
Read More