Social Media Marketing
Types Of Sponsored Social Media Marketers Use, 2011-2013 [CHART]
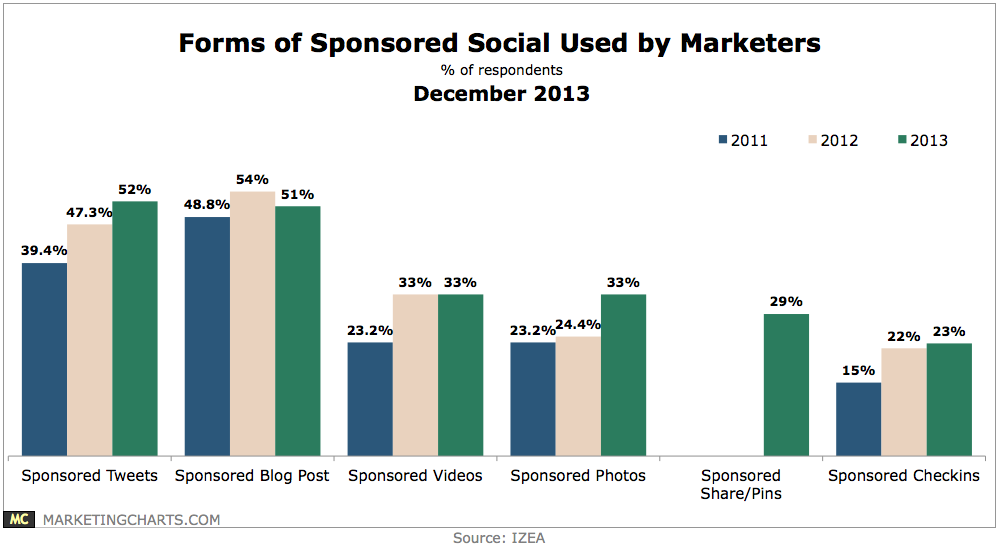
A slight majority (52%) of marketers have used Sponsored Tweets, up from 47.3% last year and 39.4% in 2011.
Read MoreSearch Traffic vs. Social Referrals, November 2012 – November 2013 [CHART]
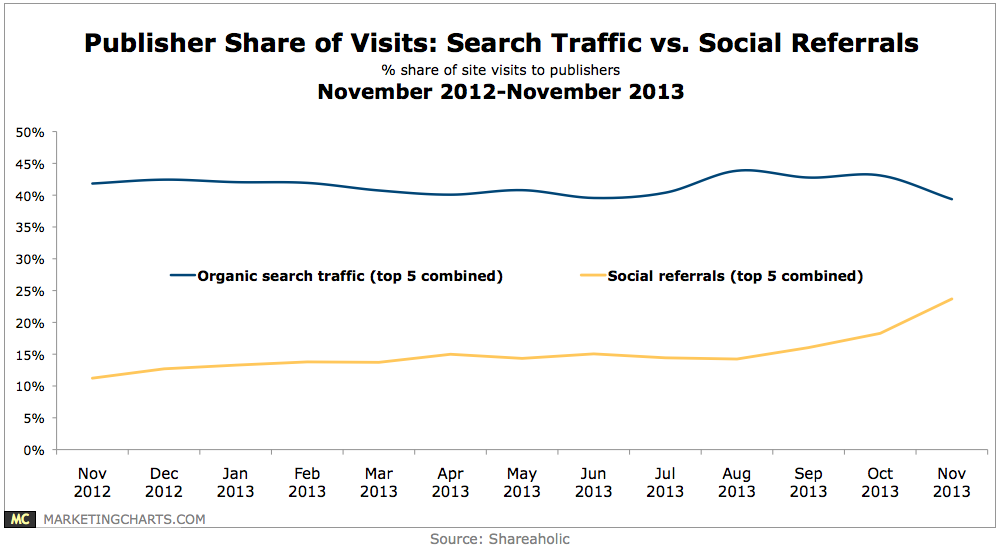
While search remains a far bigger traffic driver than social media for publishers, the gap is closing.
Read MoreGen X Social Network User Penetration, 2013 & 2017 [CHART]
Three-quarters of US Gen X internet users will log on to social networks at least monthly in 2013.
Read MoreUS Social Ad Revenue Forecast, Display vs Native 2012-2017 [CHART]
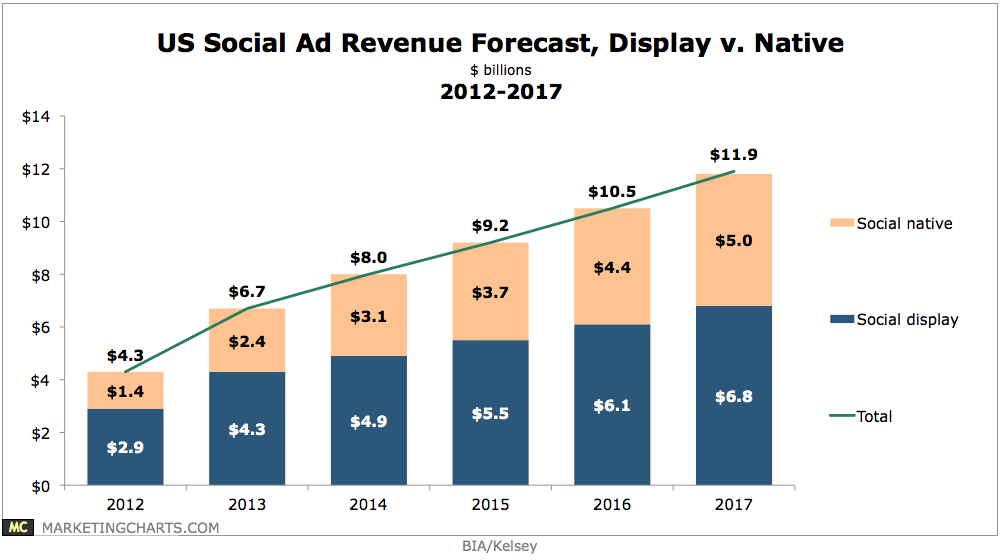
Native social ad revenues – primarily driven by Facebook’s Sponsored Stories and Twitter’s Promoted Tweets – will reach $5 billion in 2017, up from roughly $4.6 billion in the previous forecast.
Read MoreAverage Number Of Friends/Followers Women Have On Social Networks, August 2013 [CHART]
Women had an average of 250 connections on Facebook, vs. 163 on Twitter and just 89 on Instagram.
Read MoreAverage Time Women Spend on Social Networks, August 2013 [CHART]
79% of women ages 25 to 54 used Facebook regularly, compared with a dramatically lower 35% who said they regularly visited YouTube, 30% who said the same of Pinterest, 22% for Twitter, and just 13% for Instagram.
Read MoreTop 10 Smart Phone Apps Of 2013 [CHART]
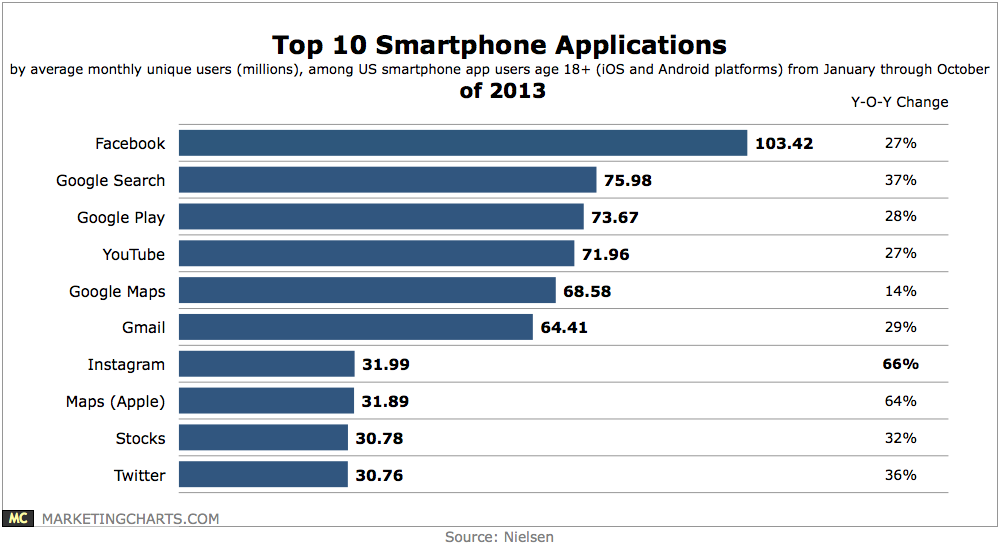
Facebook and Google are dominant among smart phone apps, accounting for 7 of the top 10.
Read MoreChanges In Twitter Ad ROI, December 2013 [CHART]
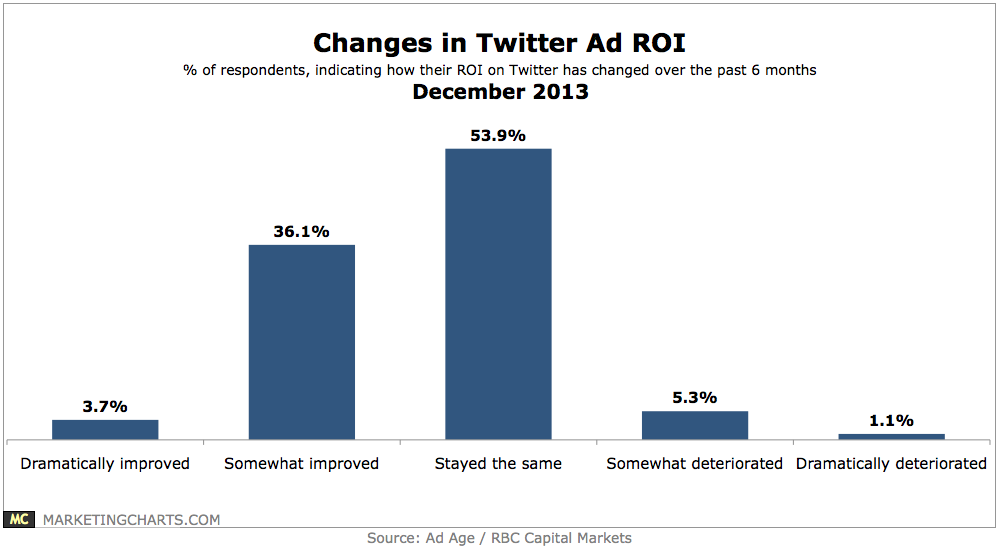
Roughly 6 in 10 marketers advertising on Twitter expect their Twitter ad budgets to increase either significantly (12.1%) or modestly (47.1%) over the next year.
Read MoreMillennials' Shared Online Experiences, December 2013 [CHART]
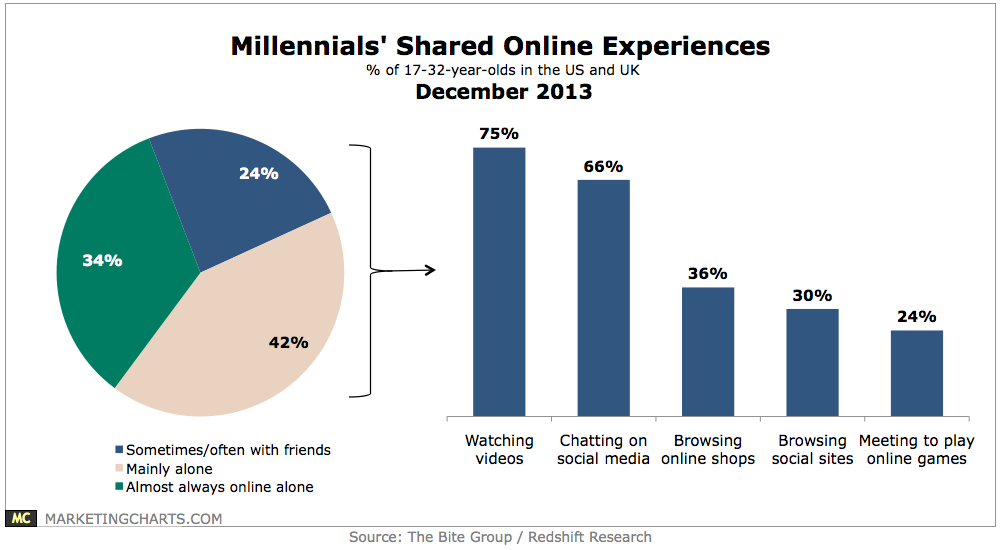
Two-thirds of Millennials said they share at least some social experiences online.
Read MoreTV Streamers' Viewing Preferences, December 2013 [TABLE]
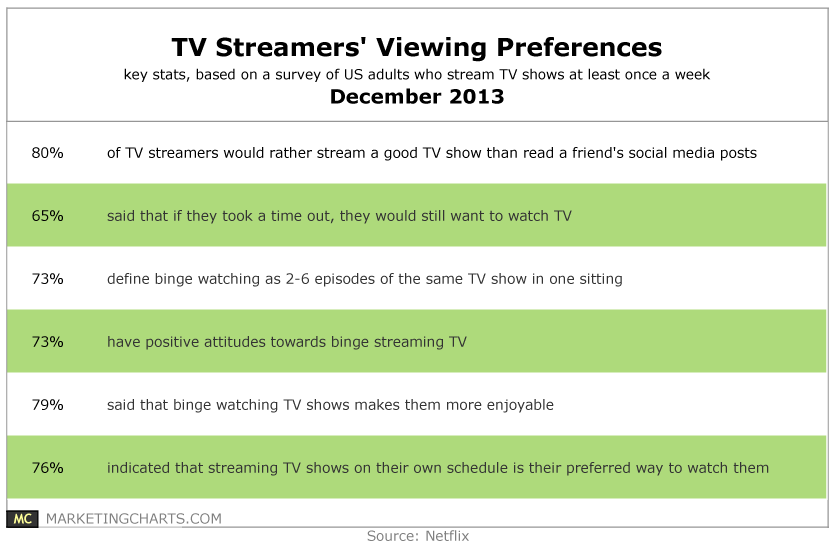
Two-thirds of TV streamers said that if they took a digital time out, they’d still want to watch TV.
Read More